
Stories
The Dot-Com Bubble Explained: How Money, IPOs and Incentives Fed the Boom
The dot-com boom through public data: IPO statistics, a record Super Bowl, analyst conflicts and what the Nasdaq did, with every number sourced.
 Capital Lessons Editorial ·
Key idea: A hot market leaves signs you can measure across the whole market, not only inside single companies. Signs help you read a market. They don’t give you a date.
On January 30, 2000, 17 of the 36 companies sponsoring the Super Bowl broadcast were related to the Internet, according to The New York Times. Advertisers paid a record average of $2.2 million for each 30 seconds of commercial time, and one of them was Pets.com.
The Nasdaq Composite closed at 3,887.07 on the Friday before the game. Its highest close came on March 10, 2000, 40 days after the game, and it was 29.9% above that Friday level. This story is about how a market got there, who paid for it, and what the public data says afterward.
What the Nasdaq did
The numbers below are daily closing levels of the Nasdaq Composite, a price index, so dividends are left out, and the companies inside the index change over time.
| Date | Close | What was going on |
|---|---|---|
| Dec. 29, 1995 | 1,052.13 | Start of the period in this story |
| Dec. 5, 1996 | 1,300.12 | Alan Greenspan’s “irrational exuberance” speech |
| Jan. 28, 2000 | 3,887.07 | Friday before the Super Bowl |
| Dec. 29, 2000 | 2,470.52 | 51.1% below the March 2000 peak |
| Sept. 10, 2001 | 1,695.38 | 66.4% below the March 2000 peak |
The peak close came on March 10, 2000, about 3.9 times the level on the day of Greenspan’s speech. The lowest close came in October 2002, more than three quarters below the peak. The index took about 15 years to close above its peak again, in 2015.
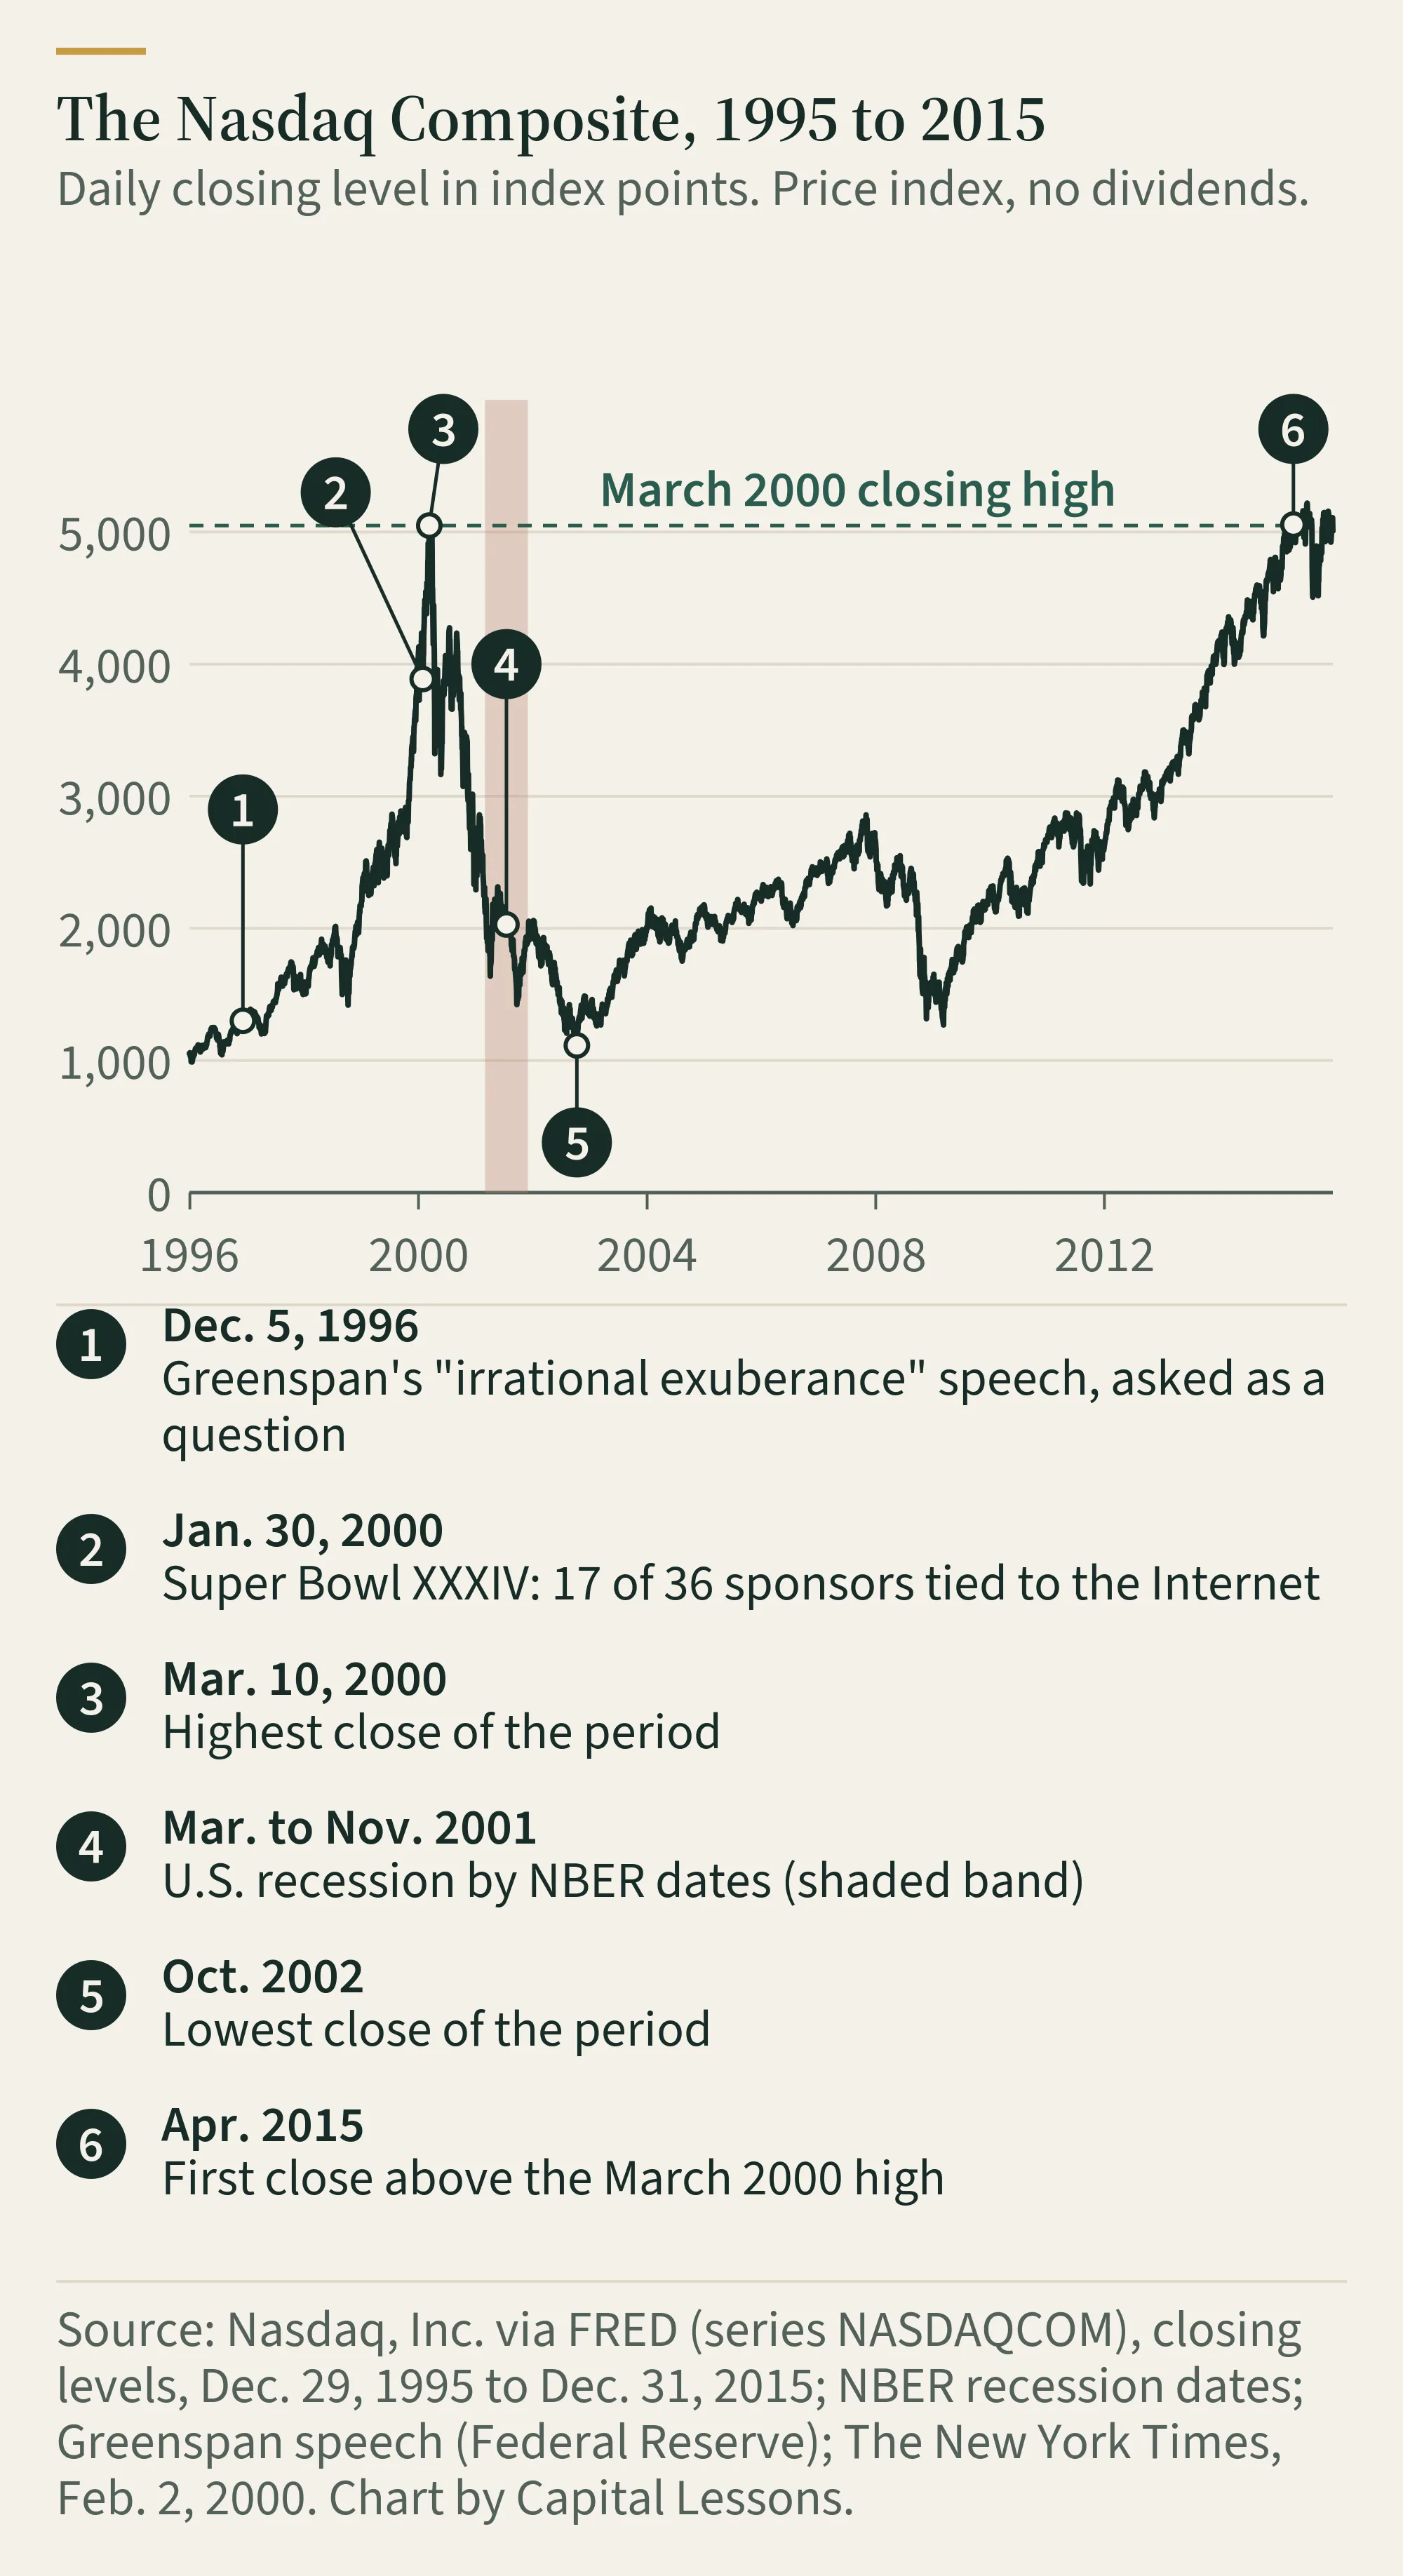
On the speech: Greenspan asked a question. He said, “But how do we know when irrational exuberance has unduly escalated asset values, which then become subject to unexpected and prolonged contractions as they have in Japan over the past decade?” He was talking about how central bankers should think about asset prices. It wasn’t a forecast, and the index kept rising for more than three years after that day.
Where the money came from: IPOs
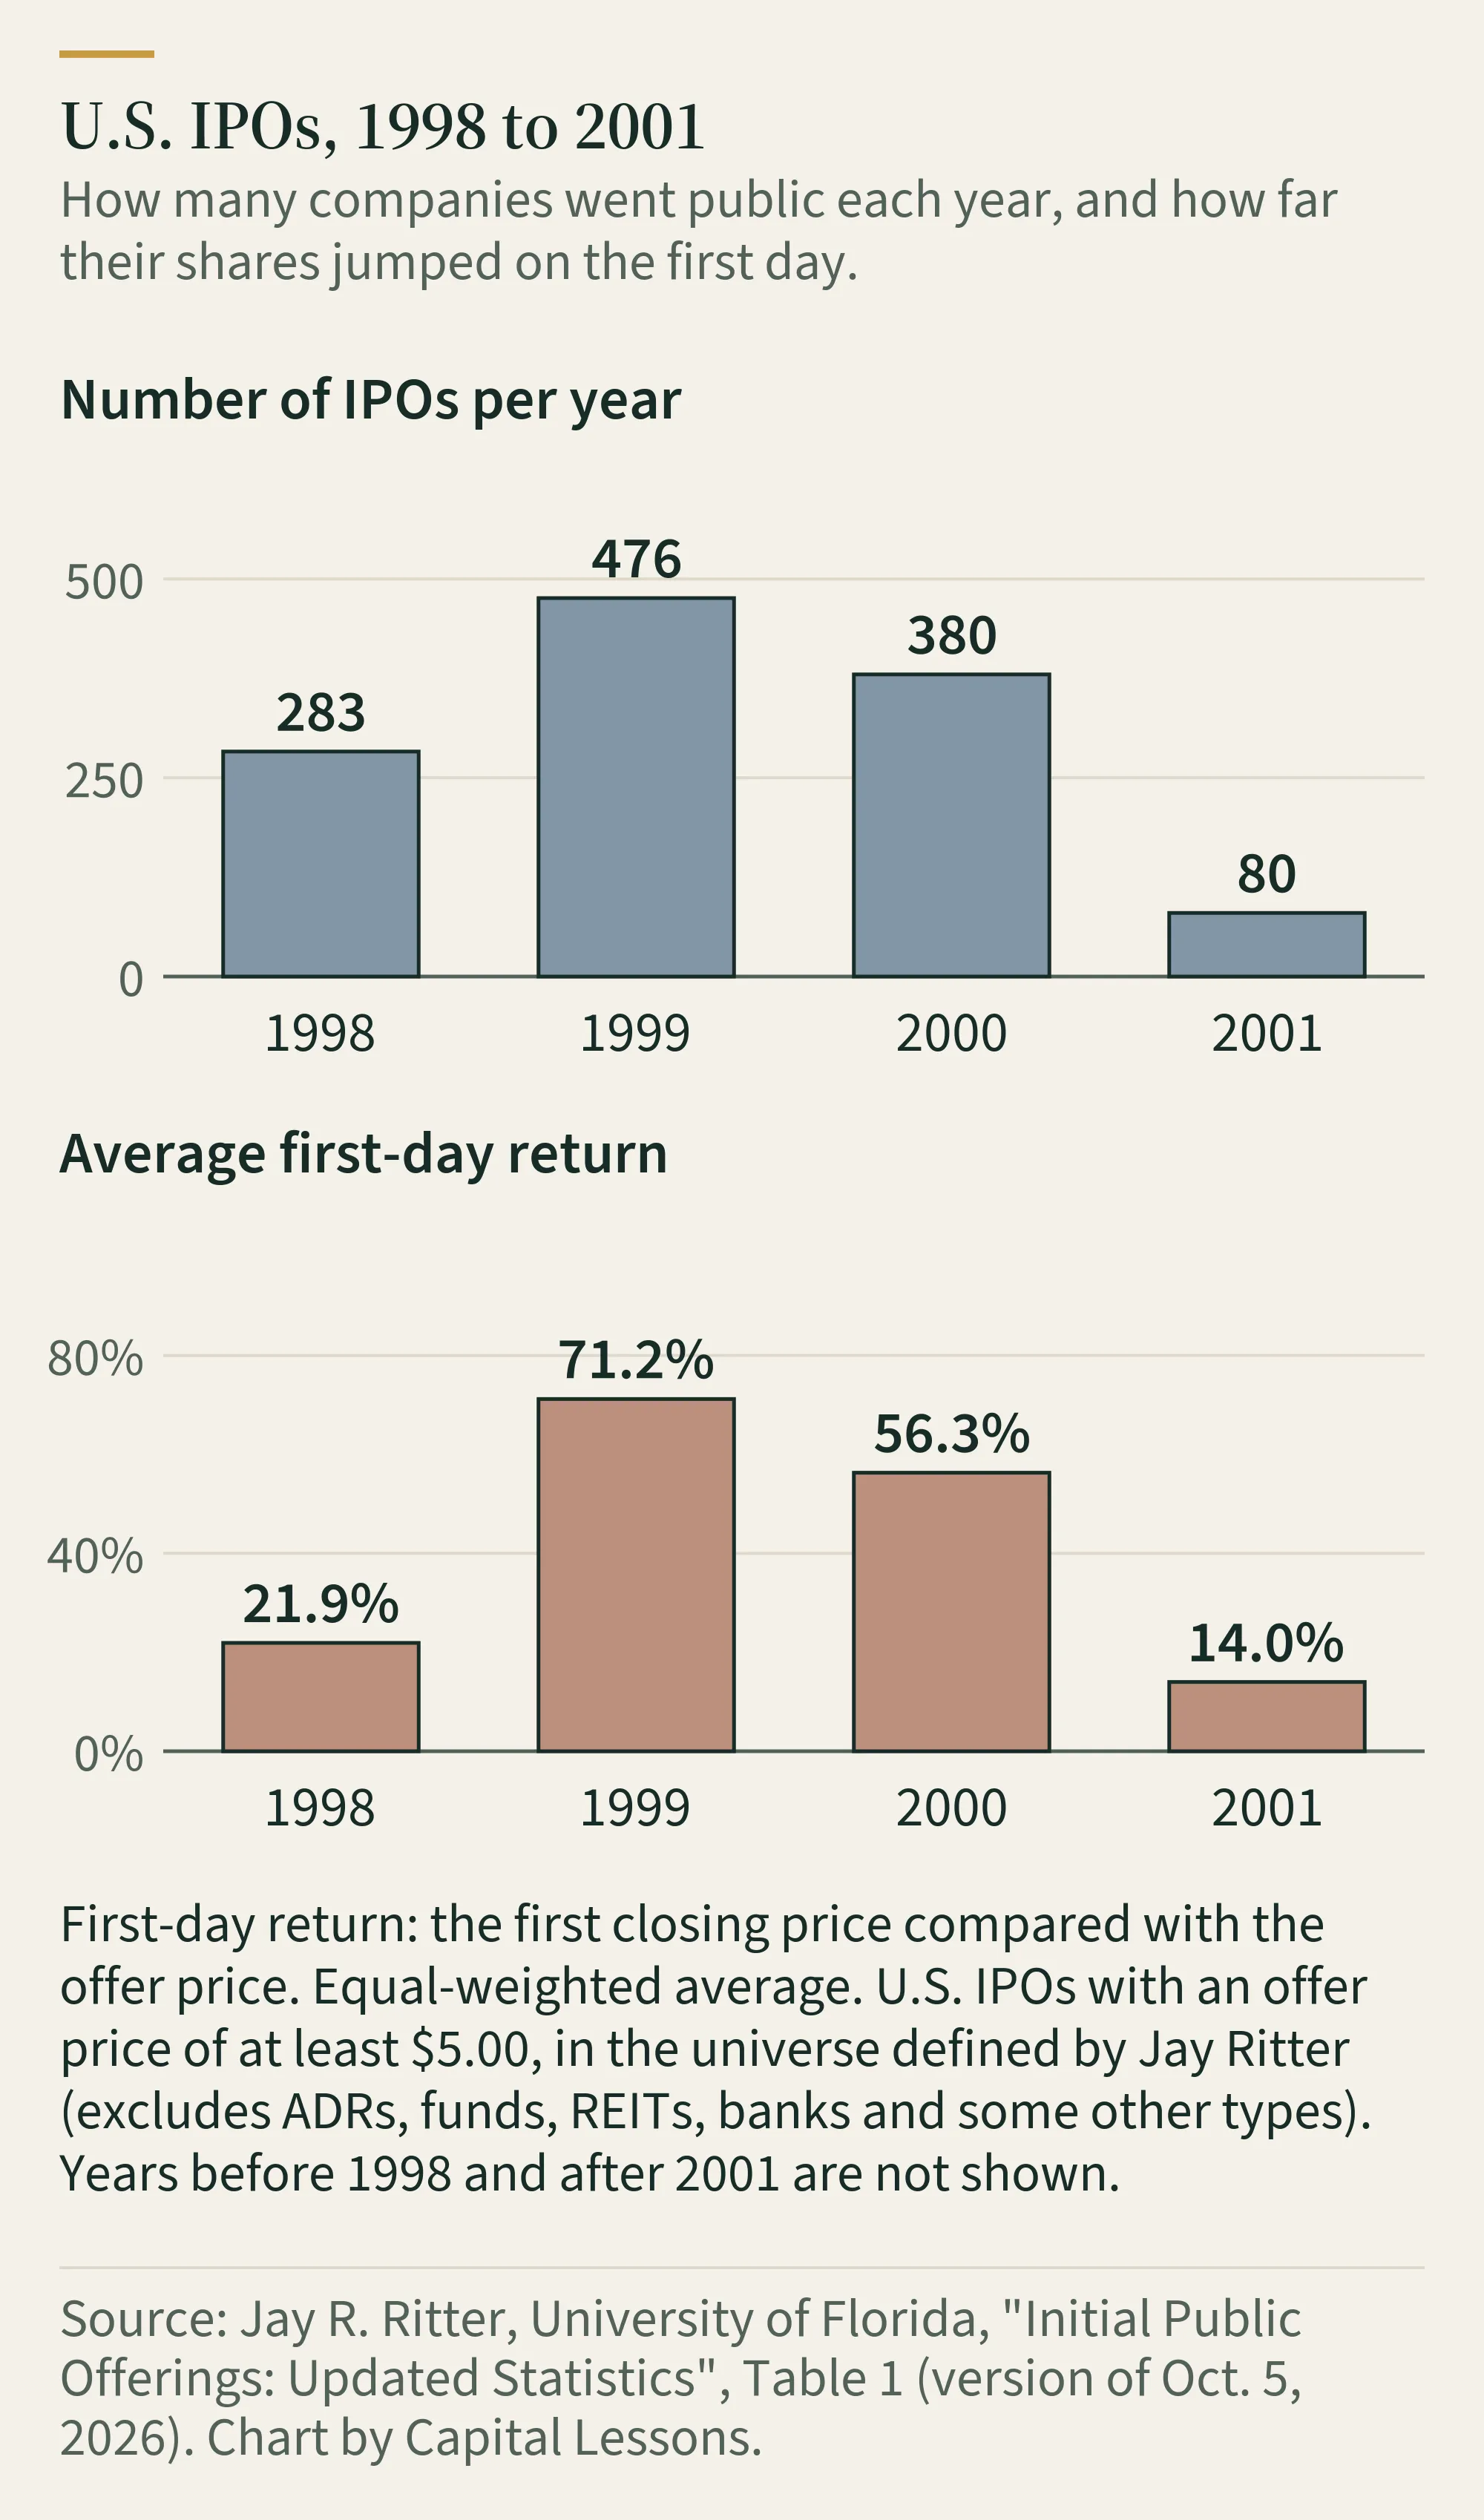
An IPO is the first time a company sells its shares to the public. Jay Ritter at the University of Florida keeps the standard public statistics on them. His tables cover U.S. IPOs with an offer price of at least $5.00 and leave out ADRs, funds, REITs, banks and some other types.
| Year | IPOs | Average first-day return | Aggregate proceeds |
|---|---|---|---|
| 1998 | 283 | 21.9% | $33.66 billion |
| 1999 | 476 | 71.2% | $64.67 billion |
| 2000 | 380 | 56.3% | $64.80 billion |
First-day return means the first closing price compared with the offer price. A 71.2% average means that, on average, shares closed their first day 71.2% above the offer price. Proceeds are in nominal dollars.
Ritter’s tables show what kind of companies were selling. Among IPOs of technology companies, the median price-to-sales ratio at the offer price was 8.4 in 1998, 26.5 in 1999 and 31.7 in 2000. At the first closing price it was 43.0 in 1999 and 49.5 in 2000. A ratio of 26.5 means investors were paying about $26.50 for each $1 of sales the company reported over the 12 months before the IPO.
Profits were thin. Of the technology IPOs, 36% were profitable in 1998 and 14% in both 1999 and 2000. Across all IPOs in Ritter’s universe, 46% had negative earnings per share in 1998, 76% in 1999 and 81% in 2000.
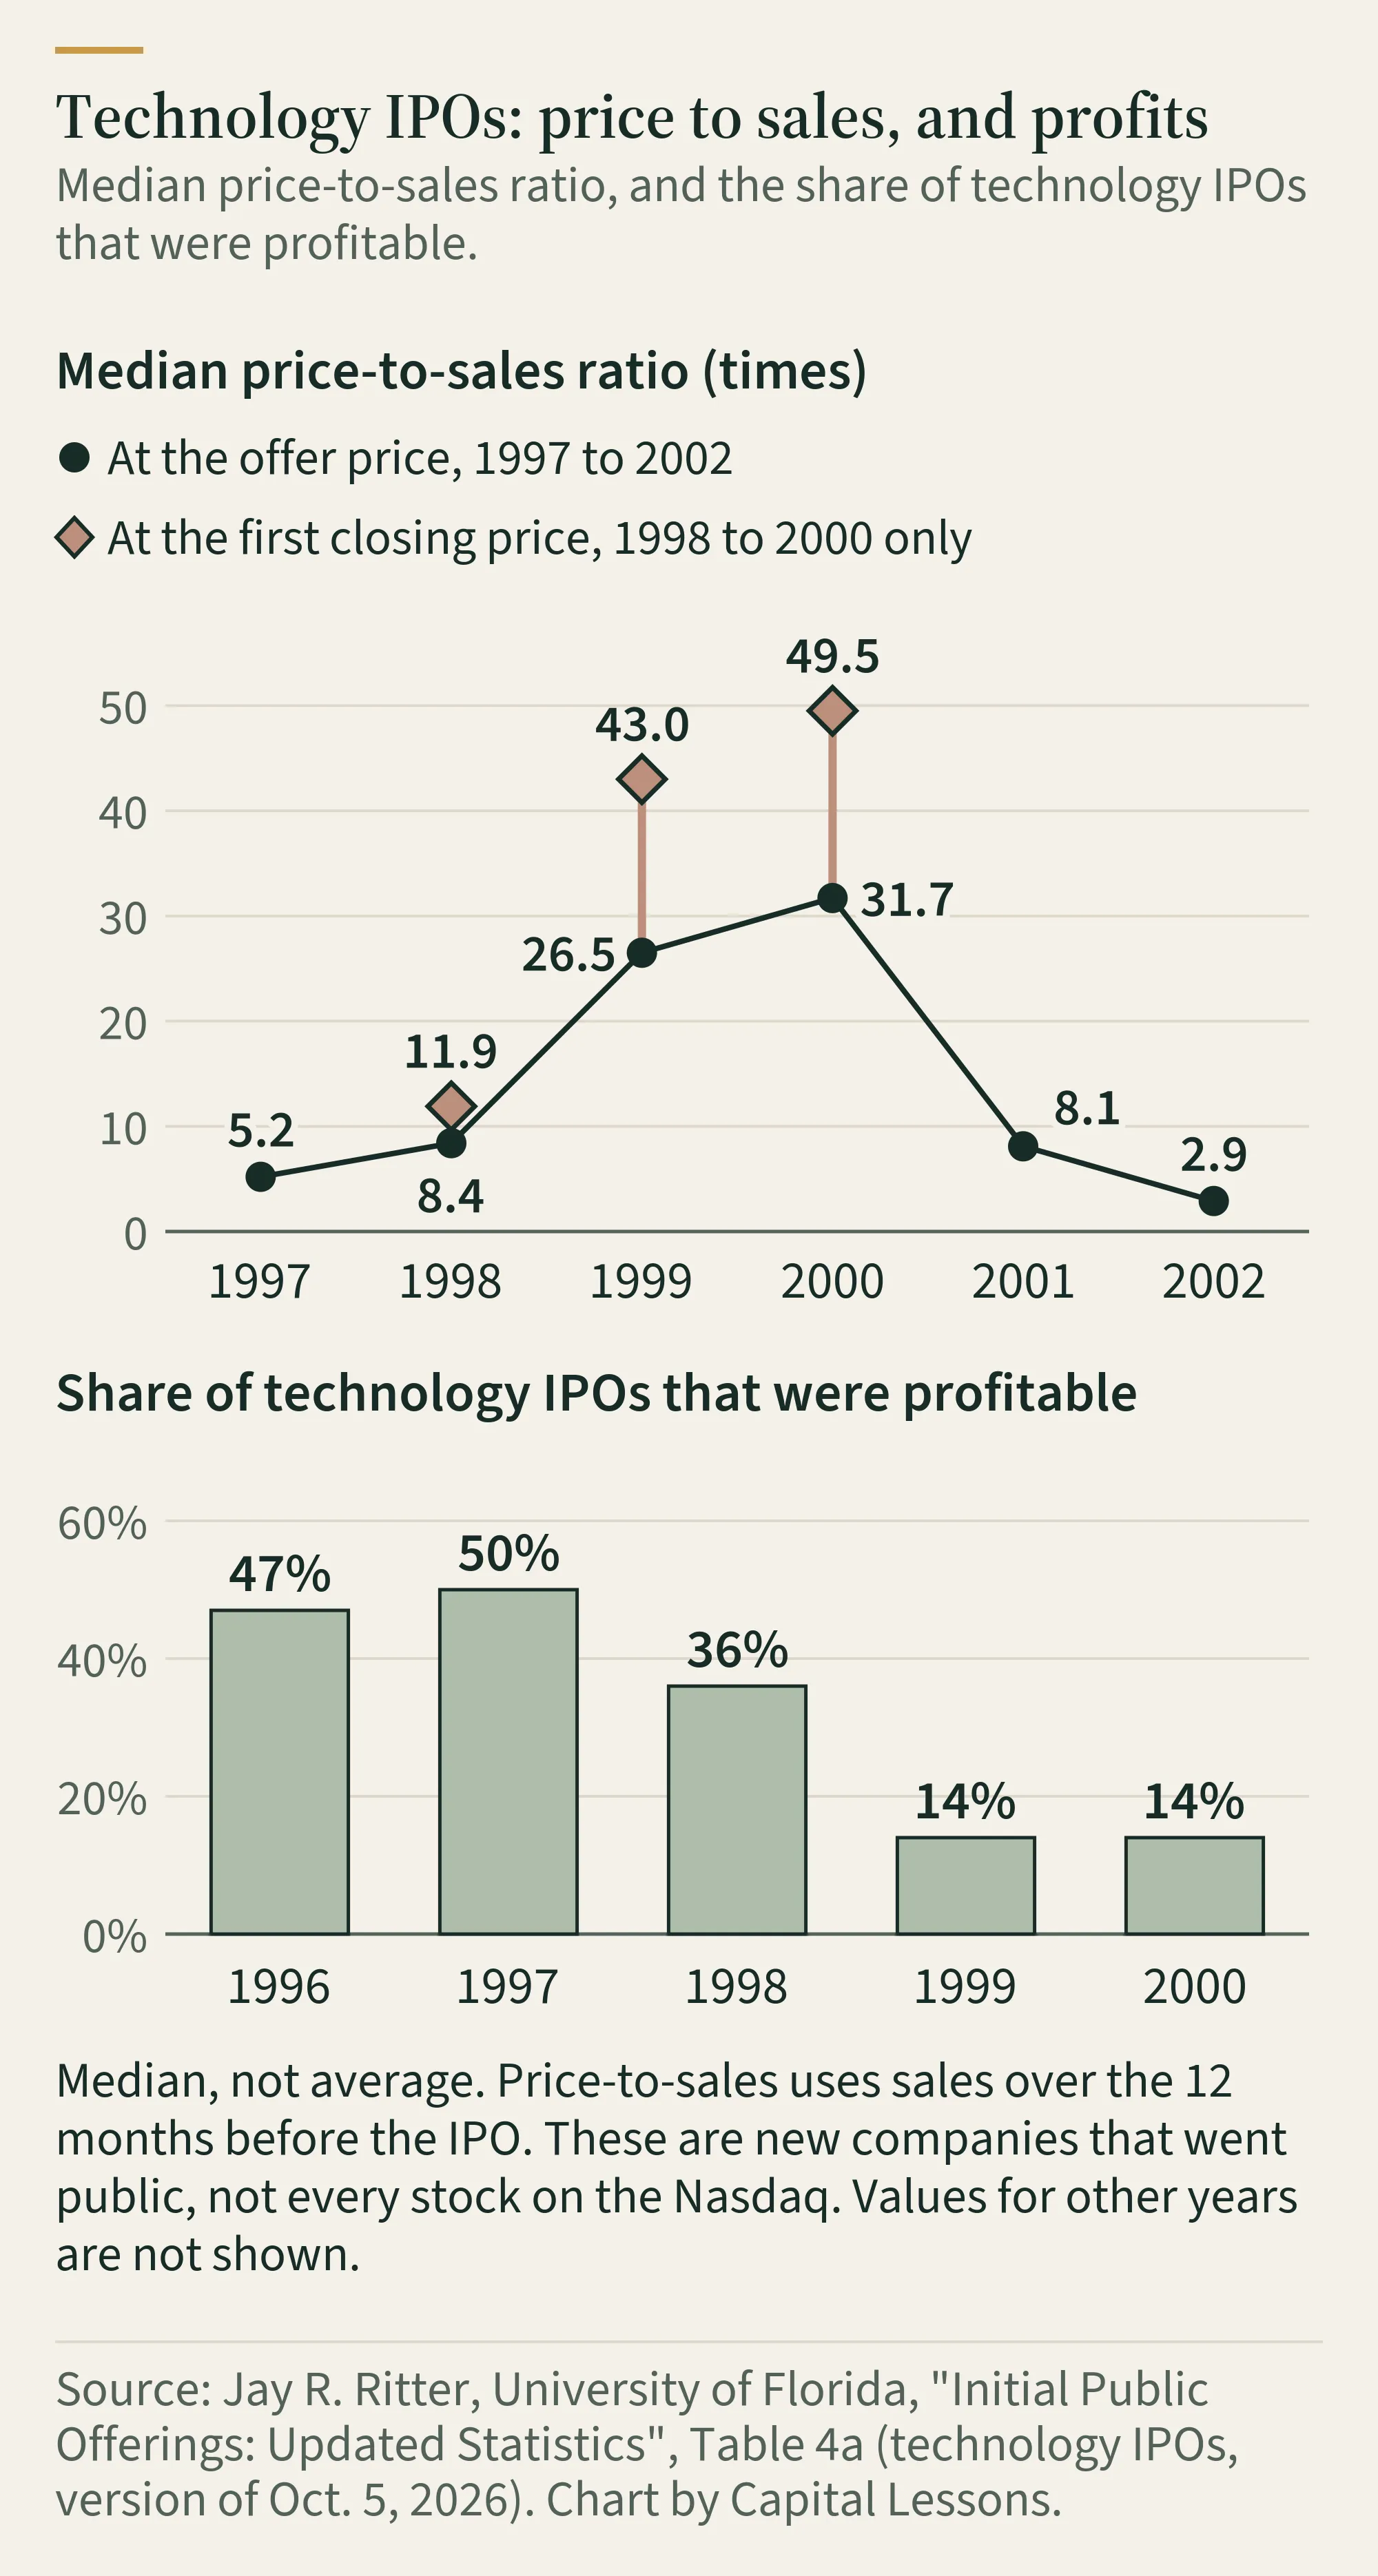
One limit matters here. These numbers describe companies that went public. They don’t describe every stock listed on the Nasdaq, and the median price-to-sales of new IPOs is not the market’s.
Who had the incentives
Many investors read research from analysts at brokerage firms. Those firms also had investment banking businesses that earned fees from companies going public.
In 2003, the SEC announced settlements with ten investment firms over conflicts between research and investment banking. The SEC alleged that, from approximately mid-1999 through mid-2001 or later, the firms created or maintained inappropriate influence by investment banking over research analysts. The firms neither admitted nor denied the allegations. They agreed to pay about $1.4 billion in total: $487.5 million in penalties, $387.5 million in disgorgement, $432.5 million to fund independent research and $80 million for investor education. They also agreed to separate research from investment banking and to stop tying analyst pay to banking revenue.
On the same day, the SEC, NASD and NYSE announced a separate settlement with Henry Blodget, a former Merrill Lynch internet analyst. The SEC alleged that his research on one company was materially misleading because it was contrary to views he expressed privately, and that his research on six other companies contained exaggerated claims or opinions with no reasonable basis. He neither admitted nor denied the allegations, paid $4 million and was permanently barred from the securities industry.
These are regulatory allegations that were settled, not court findings of guilt. Don’t read them as “all analysts lied.” The lesson is smaller and more useful. When the person recommending a stock can also earn from the company behind it, read the recommendation with that in mind.
Money and the economy
Interest rates rose while the index was still climbing. The effective federal funds rate averaged 4.76% in June 1999, 5.30% in December 1999 and 6.40% in December 2000. By December 2001 it was 1.82%. The National Bureau of Economic Research dates a U.S. recession from March 2001 to November 2001.
Those are documented dates. They don’t prove that rates or the recession caused the fall in the Nasdaq, and this story doesn’t claim that.
Companies and prices are different things
Two companies show the gap between the business and the stock.
Cisco’s stock closed at $80.06 on March 27, 2000, adjusted for splits. In fiscal 2001, which ended in July 2001, it reported a net loss of $1.014 billion, including a $2.249 billion charge for excess inventory. Its lowest quarterly closing price in its fiscal 2002 table was $11.24. Cisco’s stock closed above its 2000 high again on December 10, 2025, at $80.25, according to CNBC. In between, the company went back to profit.
Amazon’s intraday high was $113.00 in the fourth quarter of 1999 and its intraday low was $5.97 in the third quarter of 2001. Over those years its net sales grew from $1.64 billion to $3.12 billion, and it still lost $567.3 million in 2001.
Cisco’s prices are closing prices and Amazon’s are intraday prices, so don’t compare the two lines. The point is that a company can do well while the price paid for it was too high for a very long time. That is the subject of our guide on good companies and good investments.
Was it a bubble?
“Bubble” is a label people put on a period after it ends. Economists Lubos Pastor and Pietro Veronesi argued that the valuations at the Nasdaq peak can be explained by unusually high uncertainty about future profits. They called the uncertainty needed “high but plausible.” That doesn’t make the prices cheap. It means that calling them irrational is a judgment and not a measurement.
What you can take from it
Three signs showed up across the market of new companies in 1999 and 2000:
- Most IPOs had negative earnings.
- Prices were very high compared with sales.
- Shares jumped on the first day by far more than in earlier years.
Signs like these tell you the market is paying a lot for the future. They don’t tell you when it stops. The data in this story has no valuation of today’s market, and the level of an index alone can’t tell you whether today is expensive or cheap. We make no comparison with any market after 2002.
Keep reading
Cisco kept earning money while its stock fell. Our guide on good companies and good investments explains how to separate the company from the price. If you want to check price-to-sales and profits yourself, our tools section compares stock screeners and investment platforms.
Notes on the numbers
Index levels come from Nasdaq via FRED, as of October 28, 2026. IPO statistics come from the October 5, 2026 version of Jay Ritter’s tables. The 29.9%, 51.1% and 66.4% changes and the 3.9 times figure are our own arithmetic on the sources’ numbers. SEC items are allegations settled without admission or denial. This article is educational. It isn’t personal financial advice and doesn’t recommend any security. See our Terms and Editorial Policy.
Sources
- NASDAQ Composite Index (NASDAQCOM), daily close · Nasdaq, Inc. via FRED, Federal Reserve Bank of St. Louis
- Effective Federal Funds Rate (FEDFUNDS), monthly · Board of Governors of the Federal Reserve System via FRED
- Initial Public Offerings: Updated Statistics (Tables 1, 4a and 9) · Jay R. Ritter, University of Florida
- Super Bowl Spots Seem to Work for Many Dot-Coms · The New York Times, Feb. 2, 2000
- Remarks by Chairman Alan Greenspan, The Challenge of Central Banking in a Democratic Society, Dec. 5, 1996 · Board of Governors of the Federal Reserve System
- Ten of Nation's Top Investment Firms Settle Enforcement Actions Involving Conflicts of Interest Between Research and Investment Banking (2003-54) · U.S. Securities and Exchange Commission
- SEC, NASD and NYSE Permanently Bar Henry Blodget From the Securities Industry and Require $4 Million Payment (2003-56) · U.S. Securities and Exchange Commission
- US Business Cycle Expansions and Contractions · National Bureau of Economic Research
- Cisco Systems Form 10-K for fiscal year ended July 29, 2000 · U.S. Securities and Exchange Commission (EDGAR)
- Cisco Systems Annual Report fiscal 2001 (Exhibit 13) · U.S. Securities and Exchange Commission (EDGAR)
- Cisco Systems Annual Report fiscal 2002 (Exhibit 13) · U.S. Securities and Exchange Commission (EDGAR)
- Cisco's stock closes at record for first time since dot-com peak in 2000 · CNBC, Dec. 10, 2025
- Amazon.com Form 10-K405 for 2000 · U.S. Securities and Exchange Commission (EDGAR)
- Amazon.com Form 10-K405 for 2001 · U.S. Securities and Exchange Commission (EDGAR)
- Was There a Nasdaq Bubble in the Late 1990s? (Working Paper 10581) · Lubos Pastor and Pietro Veronesi, NBER