Guides
Good Company vs Good Investment: Why the Price You Pay Matters
A great business can still be a poor purchase at the wrong price. Two dot-com era cases and a three-question check, with every number sourced.
 Capital Lessons Editorial ·
Key idea: A good company is one thing. A good investment is what you get back for the price you paid. The first doesn’t guarantee the second.
Is a great company automatically a good investment? No. A company can do very well for years and still be a poor purchase if the price you paid already assumed more than it delivered.
This guide separates the two ideas, shows one real case with numbers, and gives you three questions to ask before you buy anything. It’s educational. It doesn’t tell you what to buy.
Two different things
A good company is a good business. It grows, earns money, has an edge over competitors and is run well. That is a statement about the business.
A good investment is what you, the buyer, end up with. It depends on the price you paid, what you receive along the way, how long you hold and what the business actually does. That is a statement about your result.
These are Capital Lessons definitions, not official ones. They matter because most people mix them up. “Good company” answers only one part of the investment question, the part about the business.
Why the price carries expectations
NYU professor Aswath Damodaran puts it this way: “A good company can be a bad investment if it is priced too high.” His reasoning is that, while investing, you are “playing the expectations game.” If investors expect a company to be superbly managed and price it that way, they have to mark it down if management turns out to be only good.
Warren Buffett wrote something close in his 1989 letter to Berkshire Hathaway shareholders: “It’s far better to buy a wonderful company at a fair price than a fair company at a wonderful price.” That line says price counts. It doesn’t say good companies make bad investments.
Example 1: Cisco, the same price 25 years apart
Cisco Systems’ networking equipment served as the backbone of the internet boom, according to CNBC. Its stock closed at $80.06 on March 27, 2000, split-adjusted, the day it passed Microsoft as the most valuable publicly traded company in the world, according to CNBC. It closed above that level again on December 10, 2025, at $80.25. That is 25.7 years later, and the price was 0.2% higher.
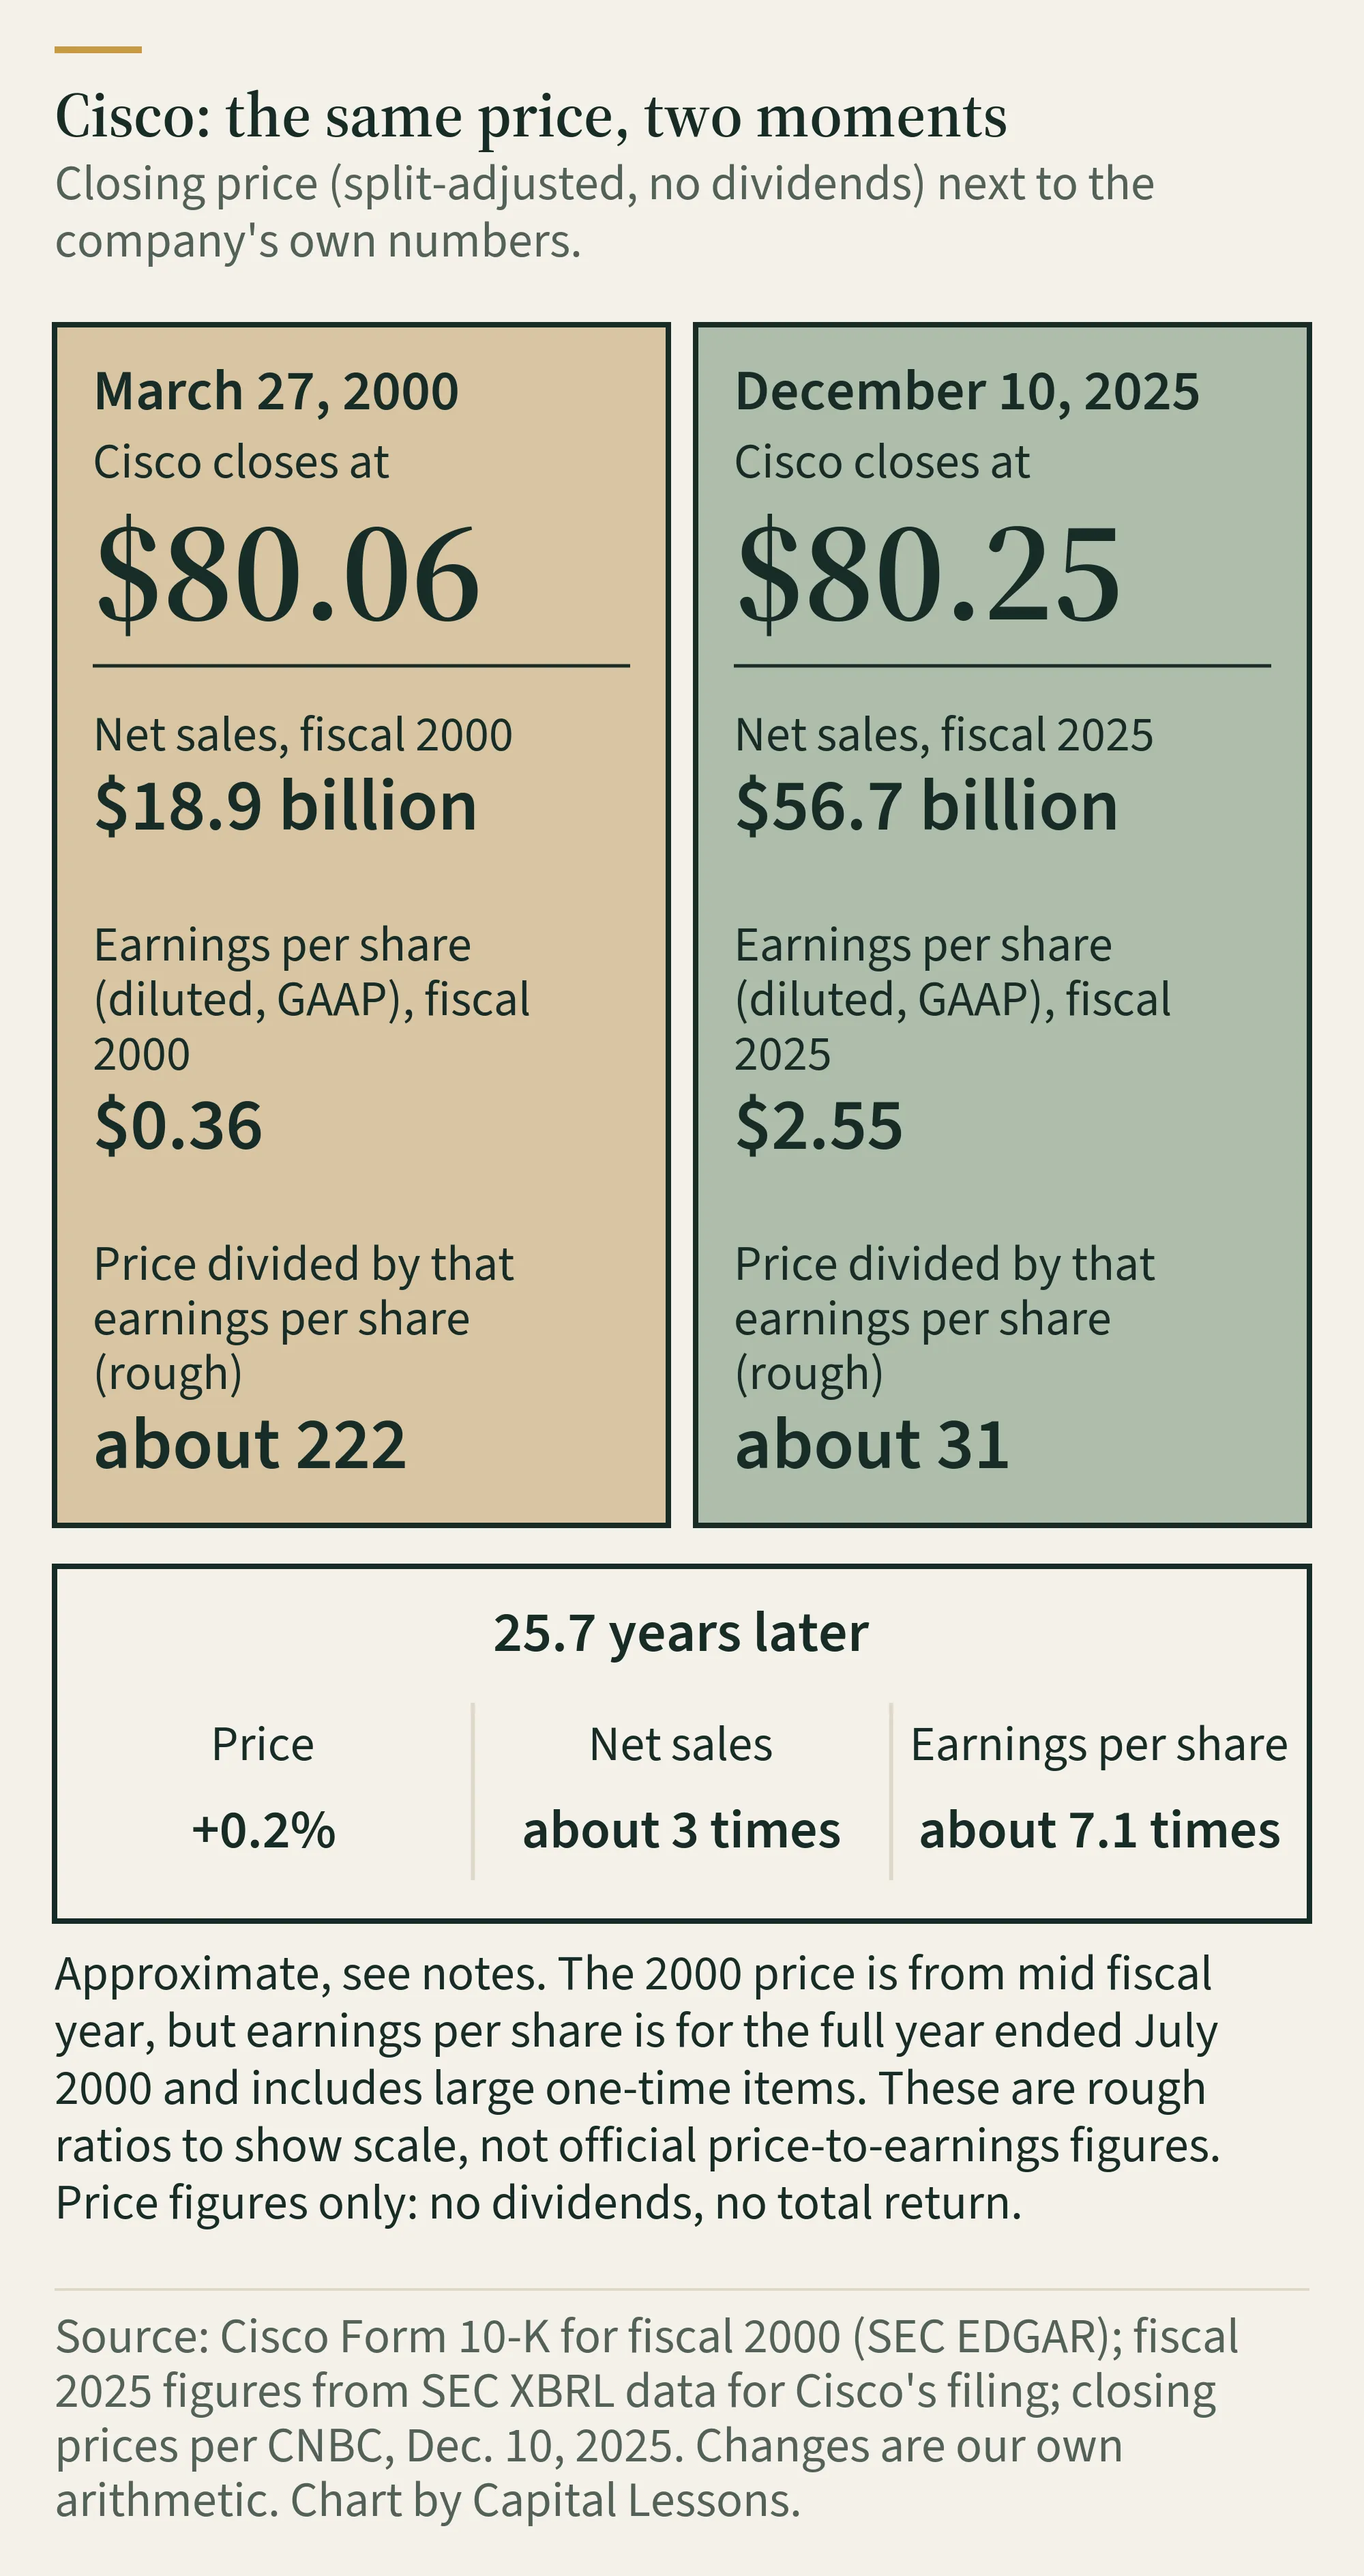
The business was not the same. Here are Cisco’s own numbers:
| Fiscal 2000 (ended July 29, 2000) | Fiscal 2025 (ended July 26, 2025) | |
|---|---|---|
| Net sales | $18.928 billion | $56.654 billion |
| Net income | $2.668 billion | $10.180 billion |
| Diluted earnings per share (GAAP) | $0.36 | $2.55 |
| Diluted shares used | about 7.438 billion | about 3.998 billion |
| Stock close used | $80.06 (March 27, 2000) | $80.25 (December 10, 2025) |
| Price divided by that year’s earnings per share | approximately 222 | approximately 31 |
Sales grew about 3 times and net income about 3.8 times. Earnings per share rose about 7.1 times, partly because Cisco has fewer shares than it did then. A share bought at about $80 in March 2000 stood for $0.36 of yearly earnings then. A share bought at about $80 in December 2025 stood for $2.55.
Read the last row with care. The 2000 price comes from the middle of a fiscal year and the earnings per share is for the full year ended in July 2000. Cisco’s reported 2000 earnings also include large one-time items such as acquired in-process research and development. The 2025 price is from December and its earnings are for the year ended July 2025. These are rough ratios to show scale, not official price-to-earnings figures.
The road in between was not smooth. In fiscal 2001, Cisco reported a net loss of $1.014 billion, including a $2.249 billion charge for excess inventory. Its lowest quarterly closing price in its fiscal 2002 table was $11.24, 86.0% below $80.06. Then profits came back: $1.893 billion in fiscal 2002 and $3.578 billion in fiscal 2003.
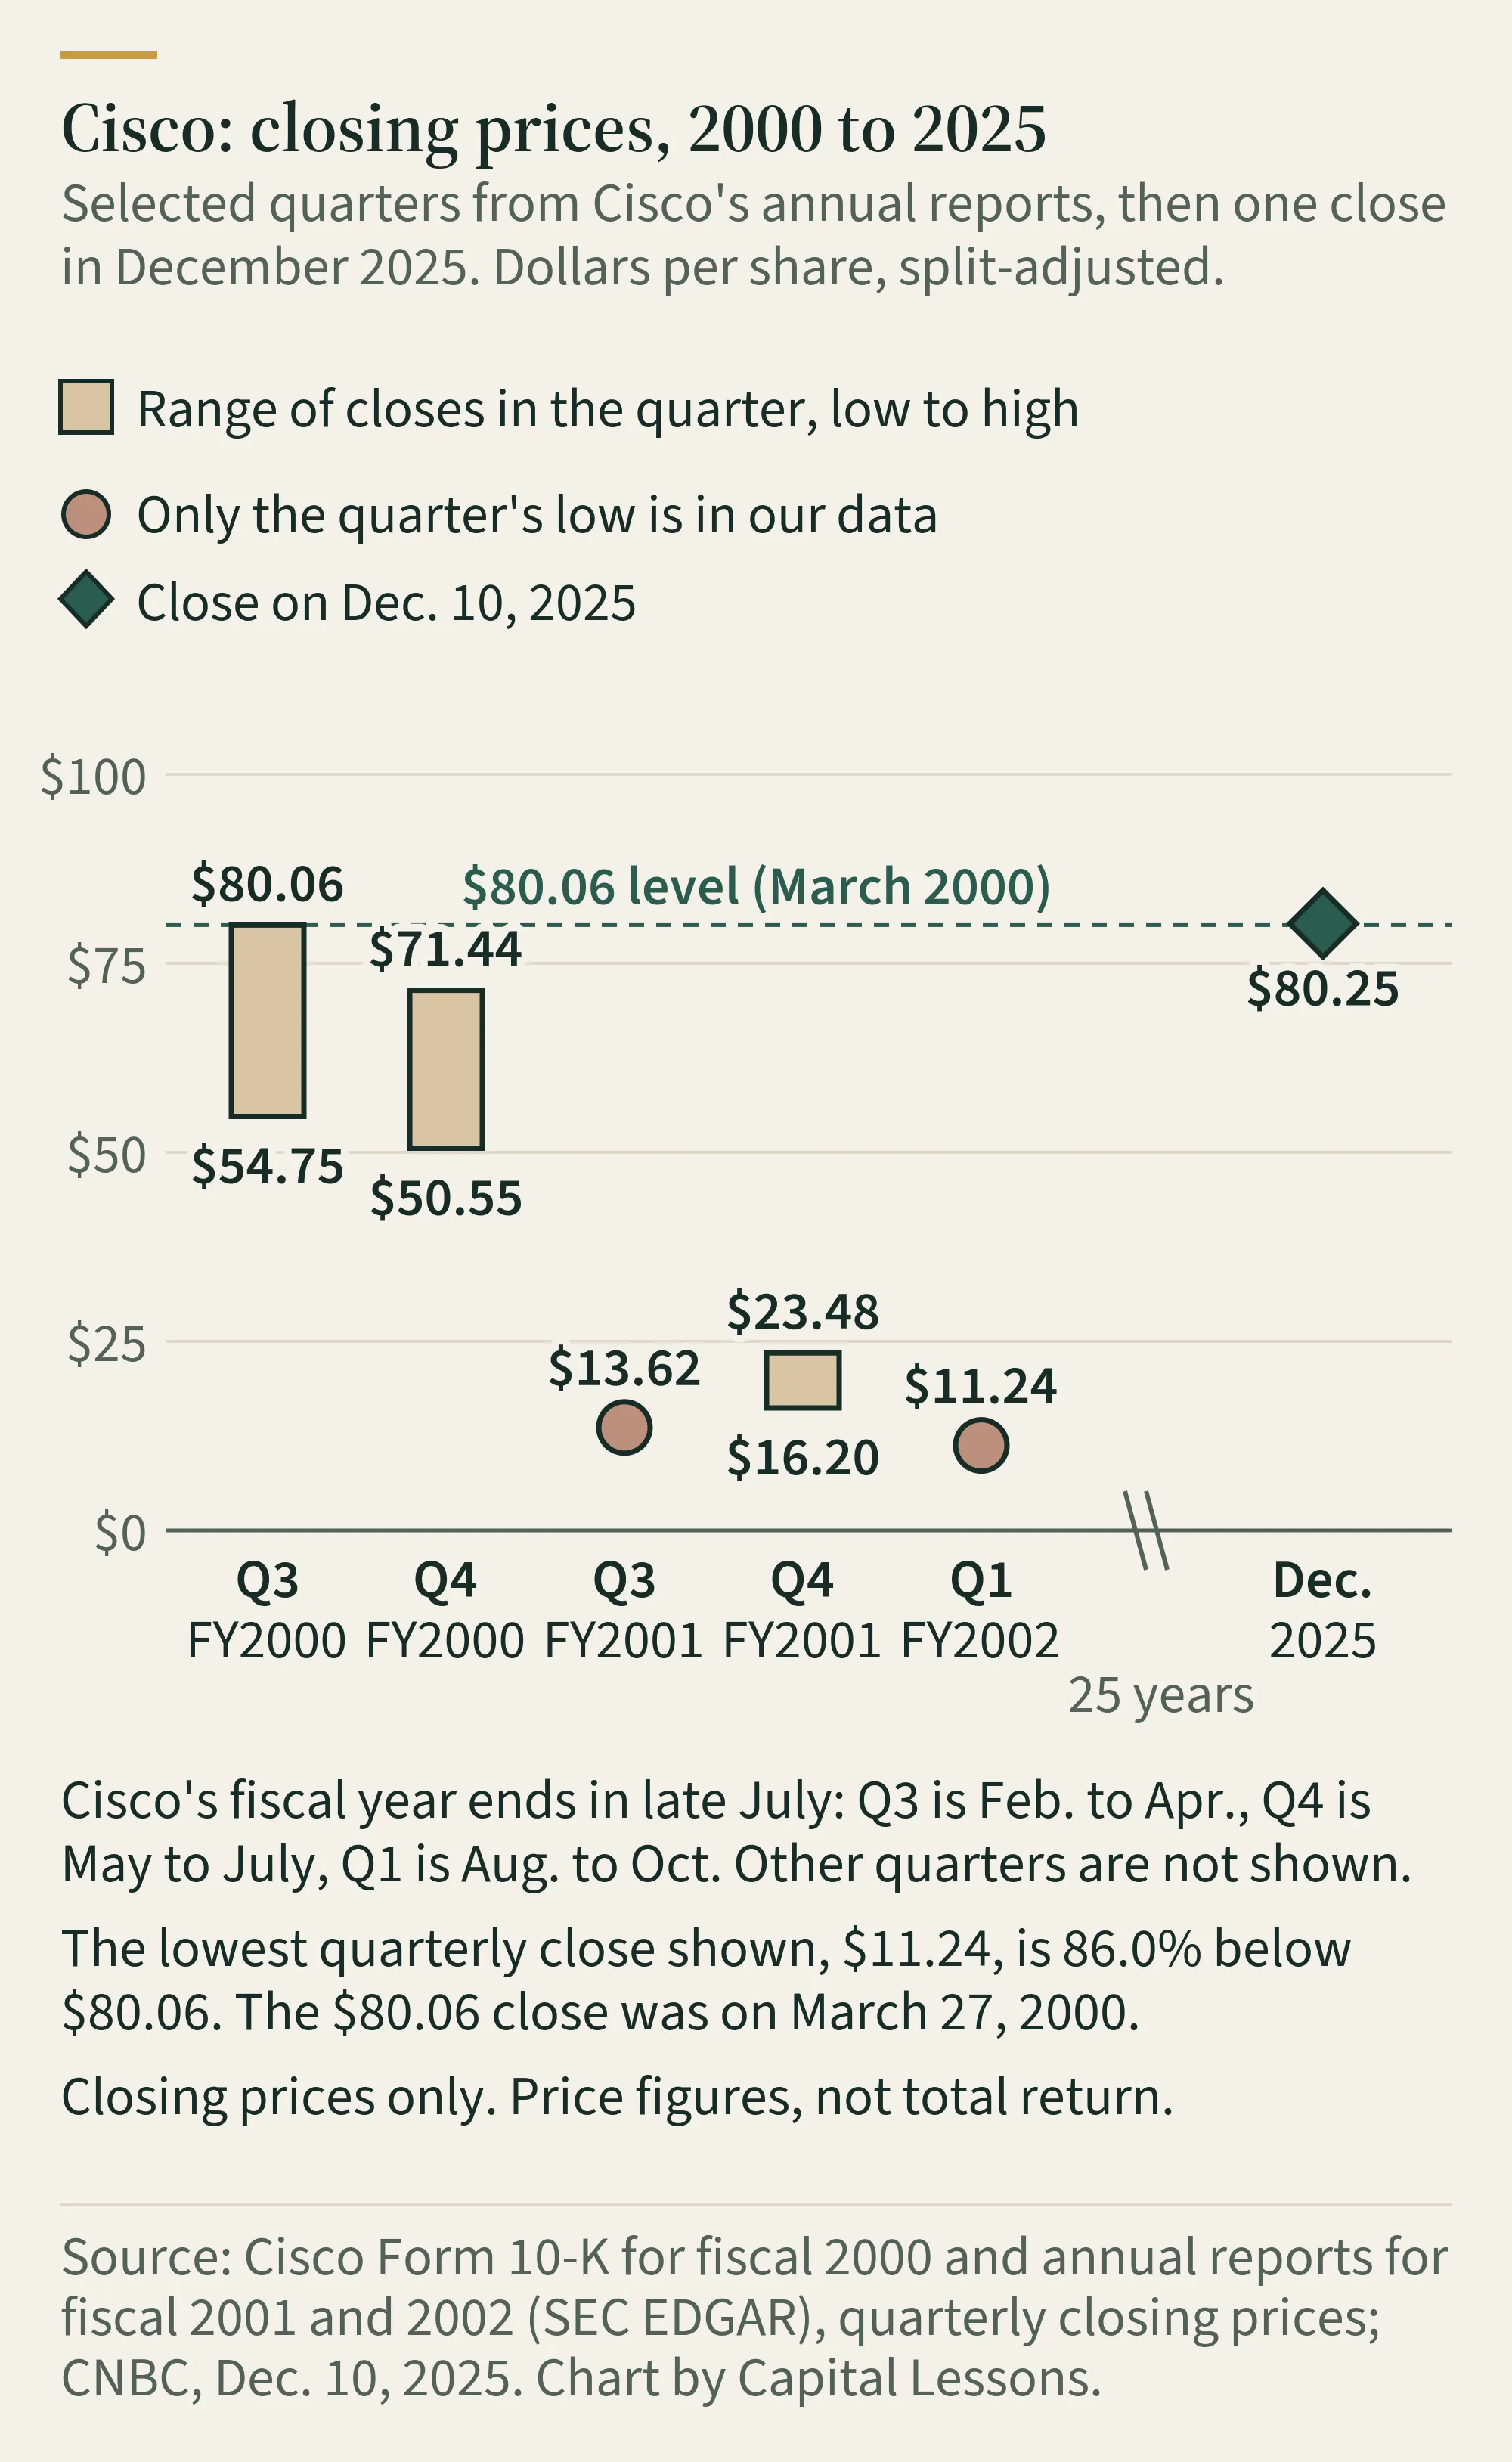
Two limits. These are price figures, and we haven’t calculated the total return including dividends, so we don’t know what a 2000 buyer ended up with overall. And nobody in March 2000 knew how much the business would grow. Saying the price was too high is a judgment made with hindsight.
Example 2: Amazon, growing sales and a falling price
Amazon’s intraday high was $113.00 in the fourth quarter of 1999, split-adjusted, and its intraday low was $5.97 in the third quarter of 2001, a drop of 94.7%. During those years its net sales kept growing:
| 1999 | 2000 | 2001 | |
|---|---|---|---|
| Net sales | $1.640 billion | $2.762 billion | $3.122 billion |
| Net loss | $720.0 million | $1.411 billion | $567.3 million |
Net sales rose 90.4% from 1999 to 2001, and the company lost money in each of those years. In the fourth quarter of 2009, Amazon’s intraday high was $145.91. We haven’t confirmed when it first traded above $113.00 again.
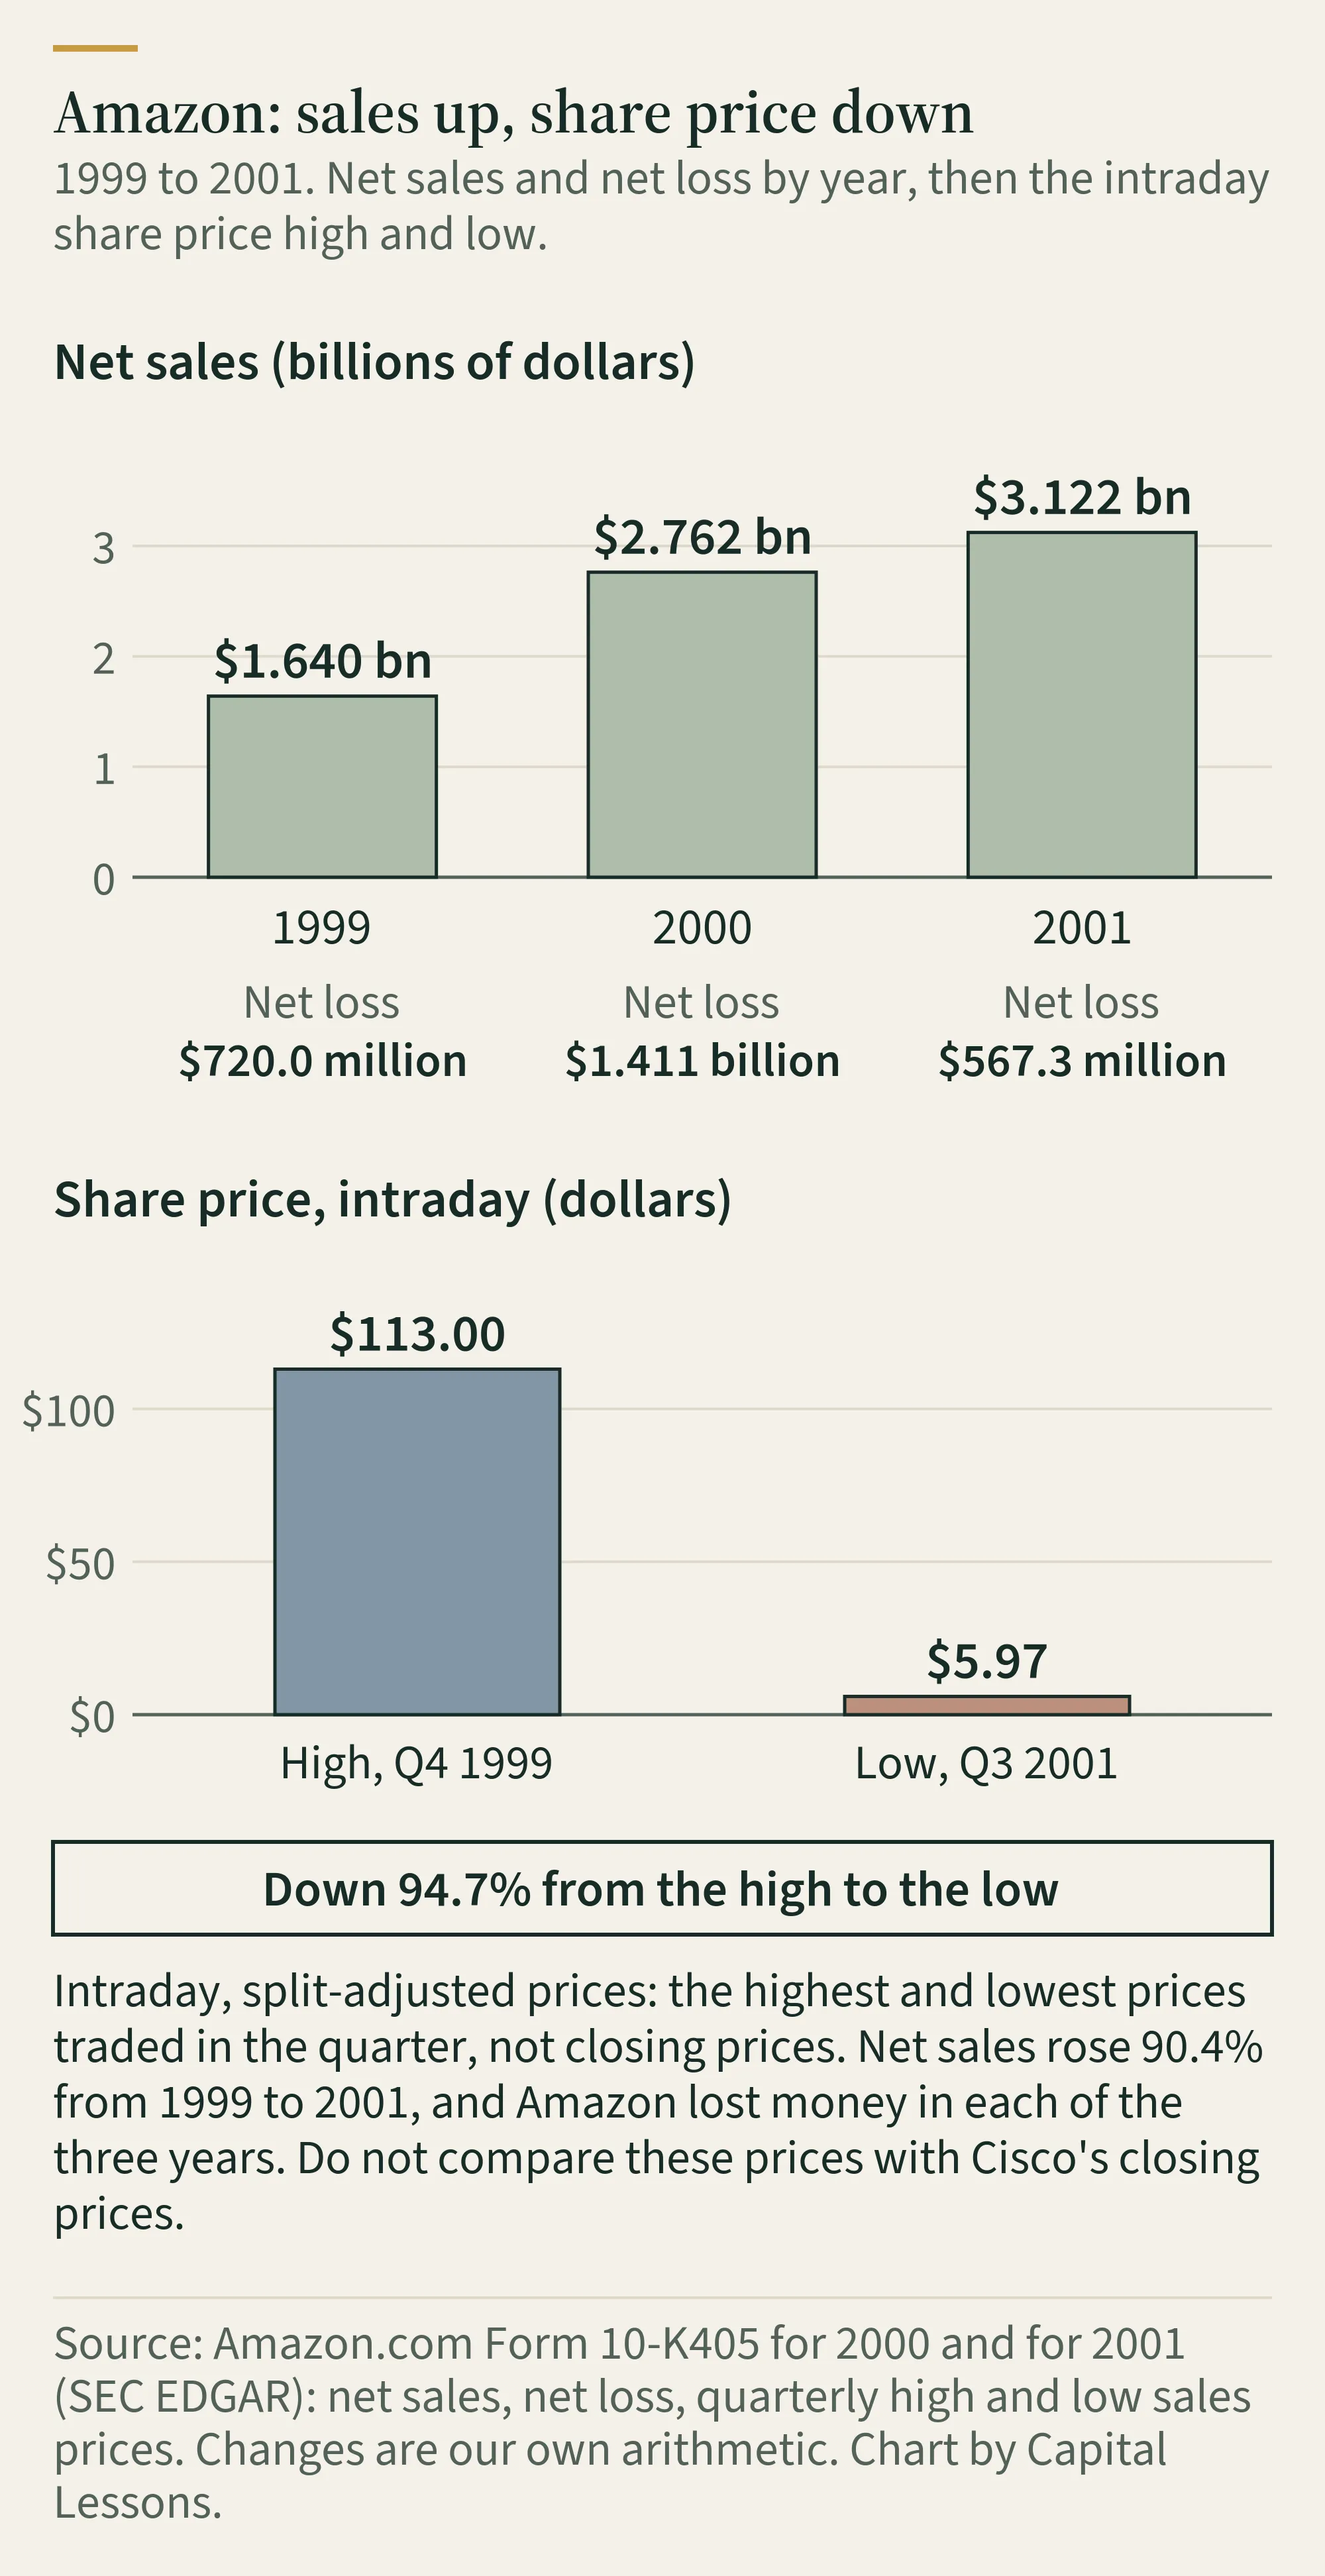
Calling Amazon a good company in 1999 is also a judgment made later. What the example shows is that growth in sales and the price you pay for that growth are separate questions.
Don’t compare Cisco’s and Amazon’s price lines directly. Cisco’s are closing prices and Amazon’s are intraday highs and lows.
Three questions before you buy
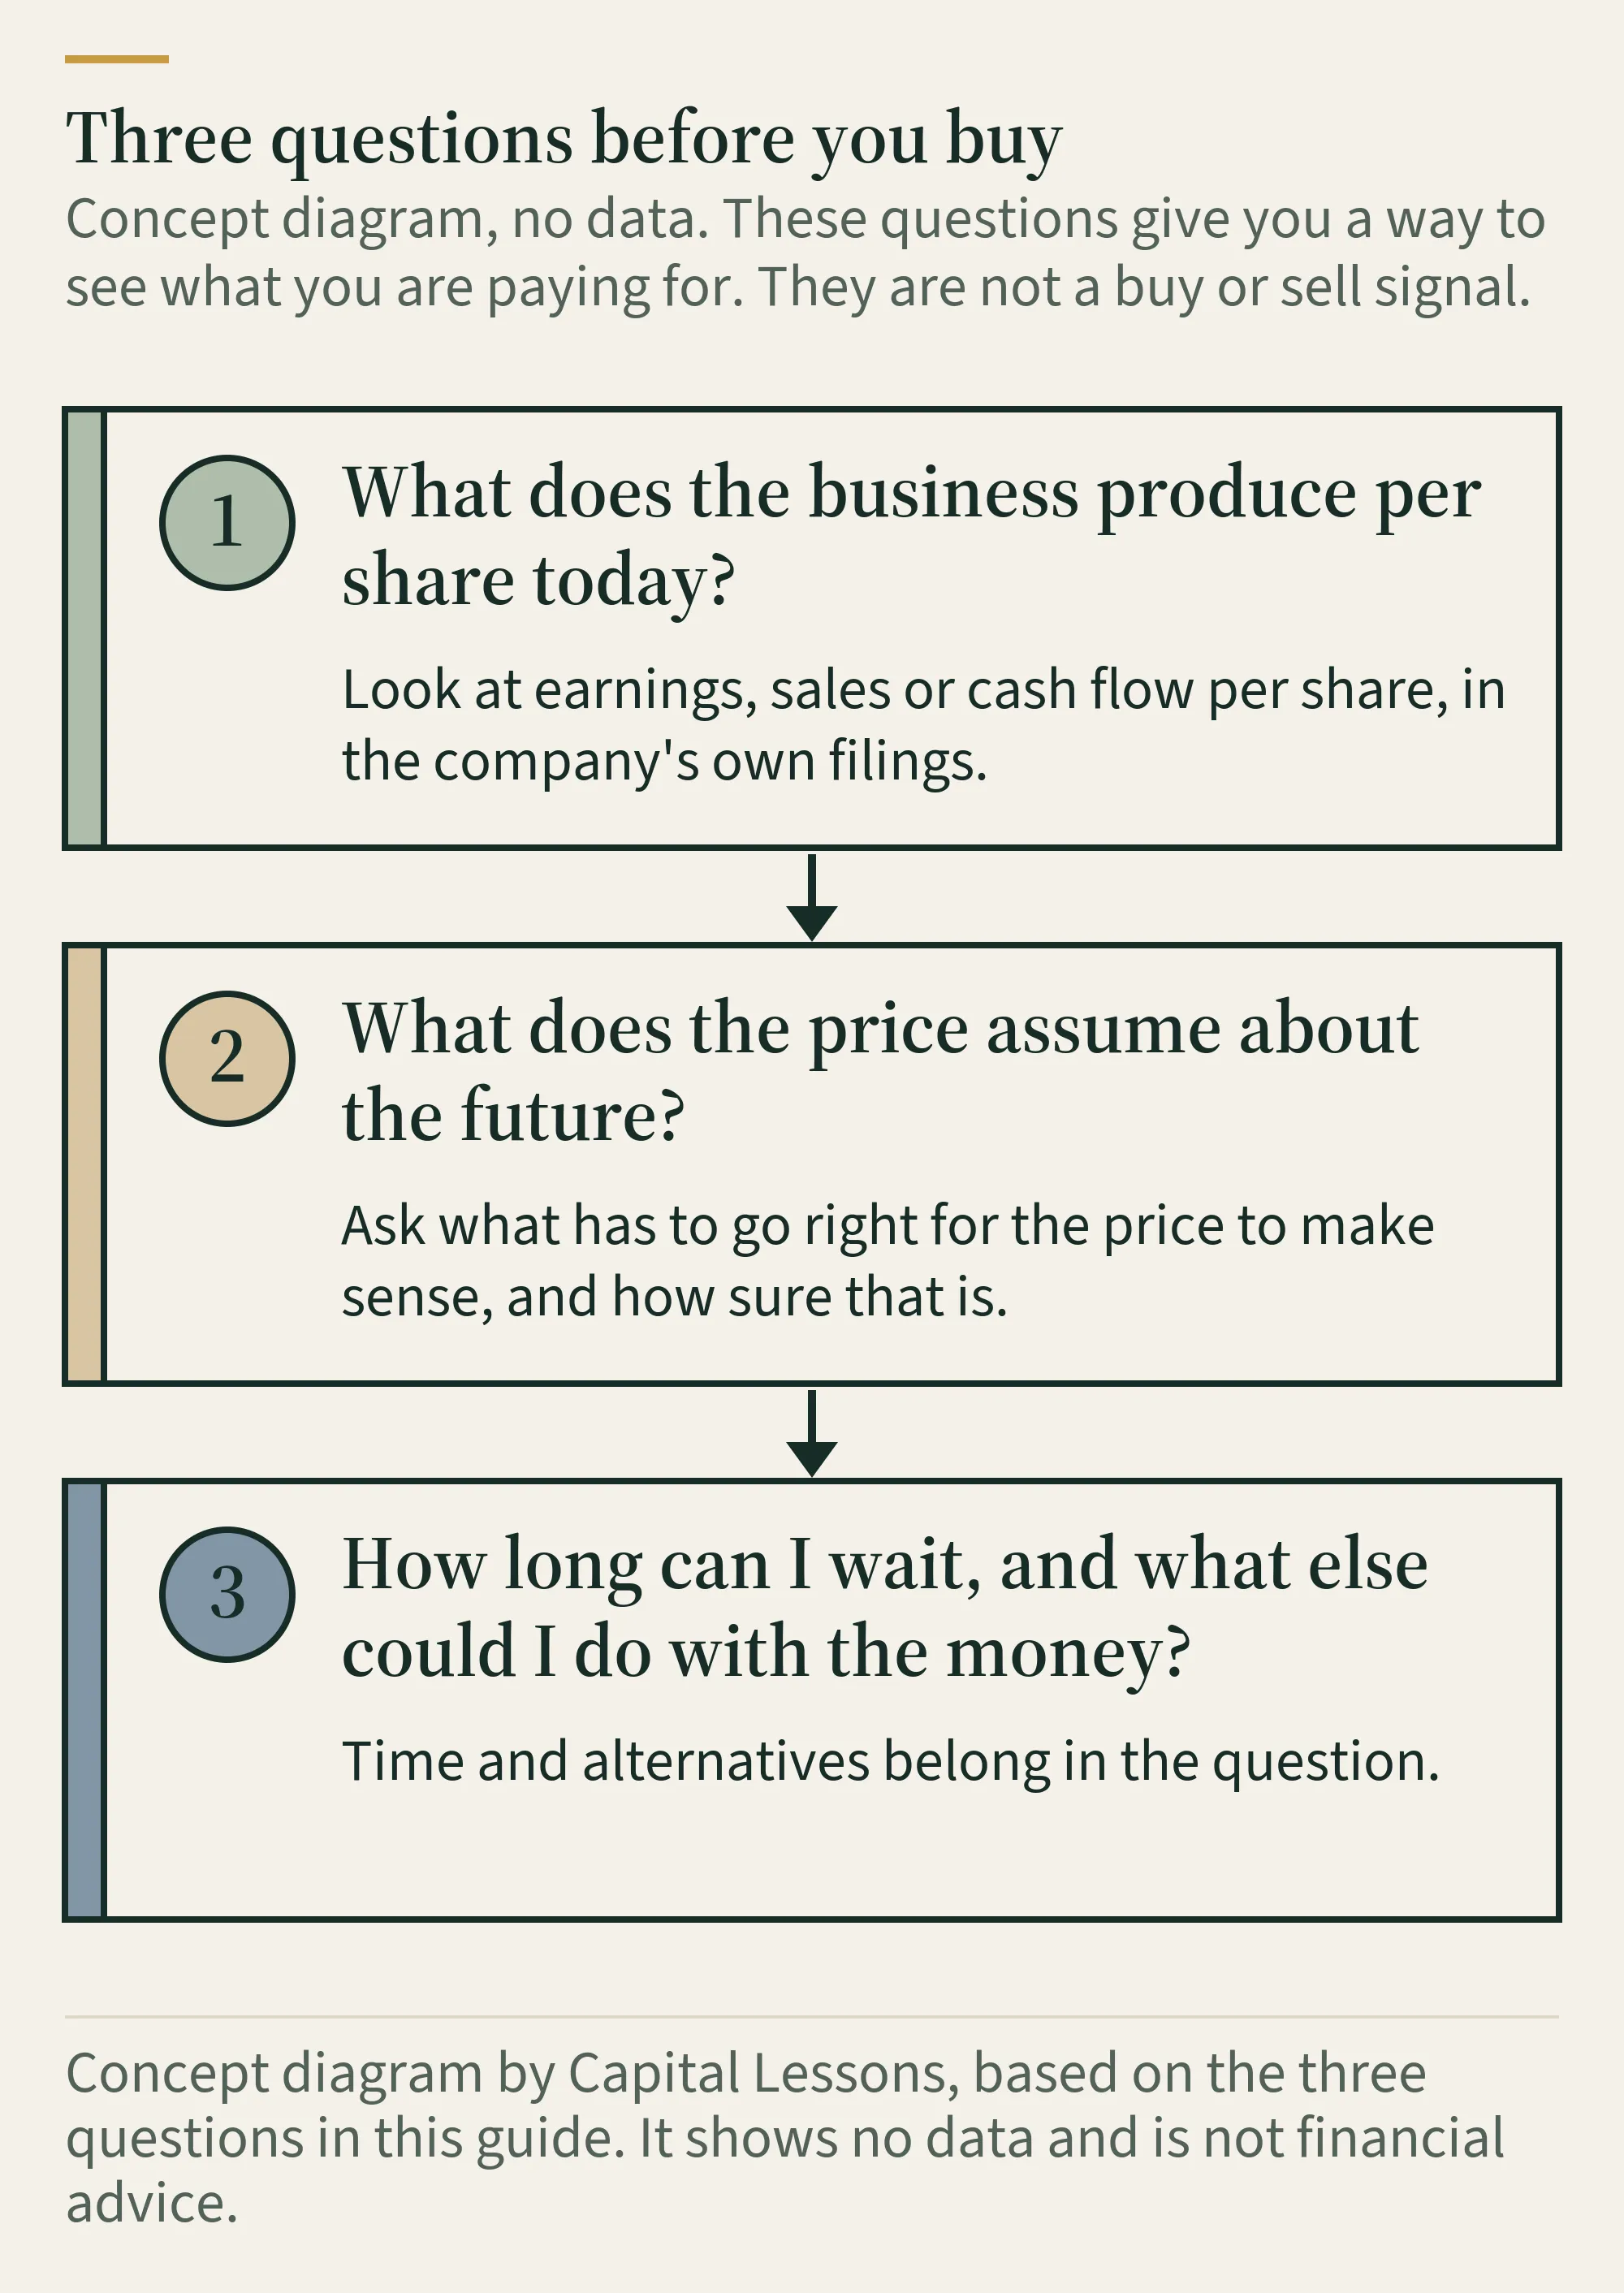
- What does the business produce per share today? Look at earnings, sales or cash flow per share, in the company’s own filings. If you can’t find a number, you don’t yet know what you’re paying for.
- What does the price assume about the future? A price of approximately 31 times earnings and one of approximately 222 times earnings ask for very different futures. Ask what has to go right for the price to make sense, and how sure that is.
- How long can I wait, and what else could I do with the money? The same company can be a fine holding for one person and a bad fit for another. Time and alternatives belong in the question.
These questions don’t give you a target price or a buy or sell signal. They give you a way to see what you are paying for.
Common mistakes
- Treating a good product as a good stock. You can love a company’s products and still overpay for its shares.
- Judging by the chart alone. A price line doesn’t show what the business earned.
- Forgetting that the examples survived. Cisco and Amazon lasted and grew, and we picked them after the fact. Companies that didn’t last aren’t in these examples, so the lesson looks cleaner than it was.
- Mixing data bases. Closing prices and intraday prices, reported earnings and adjusted earnings, and fiscal years that end in July all change the picture. Check what a number measures.
- Letting two stories become a rule. Two cases don’t prove anything about all companies.
The other side
Not every study agrees that quality gets overpriced. Researchers at the Federal Reserve Bank of New York studied Fortune magazine’s list of America’s most admired companies from 1983 to 1996. The most admired tenth earned an abnormal return of 3.2% in the year after the survey and 8.3% over three years, and the authors wrote that their results suggest “well admired firms are not overpriced.”
That sits next to this guide and doesn’t contradict it. In that sample, on average, admired companies weren’t systematically too expensive, and it was before the dot-com peak. The point here is that the relationship between price and expectations decides the result case by case. It isn’t that good companies are always bad stocks.
Keep reading
For the market around Cisco’s 2000 peak, with IPO and Nasdaq data, read our story on the dot-com bubble. To check the price side yourself, our tools section covers stock screeners and investment platforms.
Notes on the numbers
Cisco’s fiscal 2000 figures come from its annual report on Form 10-K, fiscal 2001 and 2002 figures from its annual reports, and fiscal 2025 figures from the SEC’s XBRL data for Cisco’s filing, all read on October 28, 2026. Amazon’s figures come from its Form 10-K filings. The 25.7 years, 0.2%, 86.0%, 94.7%, 90.4%, the 7.1 times, 3 times and 3.8 times figures and the two price-to-earnings ratios are our own arithmetic on the sources’ numbers. Price-to-earnings ratios are approximate for the reasons above. This article is educational. It isn’t personal financial advice and doesn’t recommend any security. See our Terms and Editorial Policy.
Sources
- Cisco Systems Form 10-K for fiscal year ended July 29, 2000 · U.S. Securities and Exchange Commission (EDGAR)
- Cisco Systems Annual Report fiscal 2001 (Exhibit 13) · U.S. Securities and Exchange Commission (EDGAR)
- Cisco Systems Annual Report fiscal 2002 (Exhibit 13) · U.S. Securities and Exchange Commission (EDGAR)
- Cisco Systems company facts (XBRL), fiscal 2025 filing 0000858877-25-000111 · U.S. Securities and Exchange Commission
- Cisco's stock closes at record for first time since dot-com peak in 2000 · CNBC, Dec. 10, 2025
- Amazon.com Form 10-K405 for 2000 · U.S. Securities and Exchange Commission (EDGAR)
- Amazon.com Form 10-K405 for 2001 · U.S. Securities and Exchange Commission (EDGAR)
- Amazon.com Form 10-K for 2009 · U.S. Securities and Exchange Commission (EDGAR)
- Do Investors Mistake a Good Company for a Good Investment? (Staff Report 60) · Antunovich and Laster, Federal Reserve Bank of New York, Jan. 1999
- In Search of Excellence! Are good companies good investments? (Chapter 6, Investment Fables) · Aswath Damodaran, NYU Stern
- Berkshire Hathaway shareholder letter for 1989 · Berkshire Hathaway Inc.