Tools
Stock Screener vs Broker: What Each Does and What It Costs
A screener finds companies, research tools help you study one, and a broker buys shares. What each does, where it stops and what it costs.
 Capital Lessons Editorial ·

Key idea: A screener helps you find companies. Research tools help you study one. A broker is where you buy shares. Many products do more than one of these jobs, and your broker may already include some, so start with what you have.
Say you want to compare a company’s price with what it earns. What you need depends on where you are.
You already know the company. You don’t need filters. Filters help you decide which companies to look at. To study one company you need its financial statements. US-listed companies file theirs for free on the SEC’s EDGAR database, and a data tool can put several years of them in one place.
You don’t know which company yet. Thousands are listed, so a stock screener helps. You pick filters, such as price-to-sales or net profit margin, and it returns a shorter list to read.
You have decided and want to buy shares. That takes a broker, the firm that holds your account and sends your orders. A screener or research tool can’t do that.
People mix these up, and the difference changes what you pay for.
Three jobs: discover, research and buy
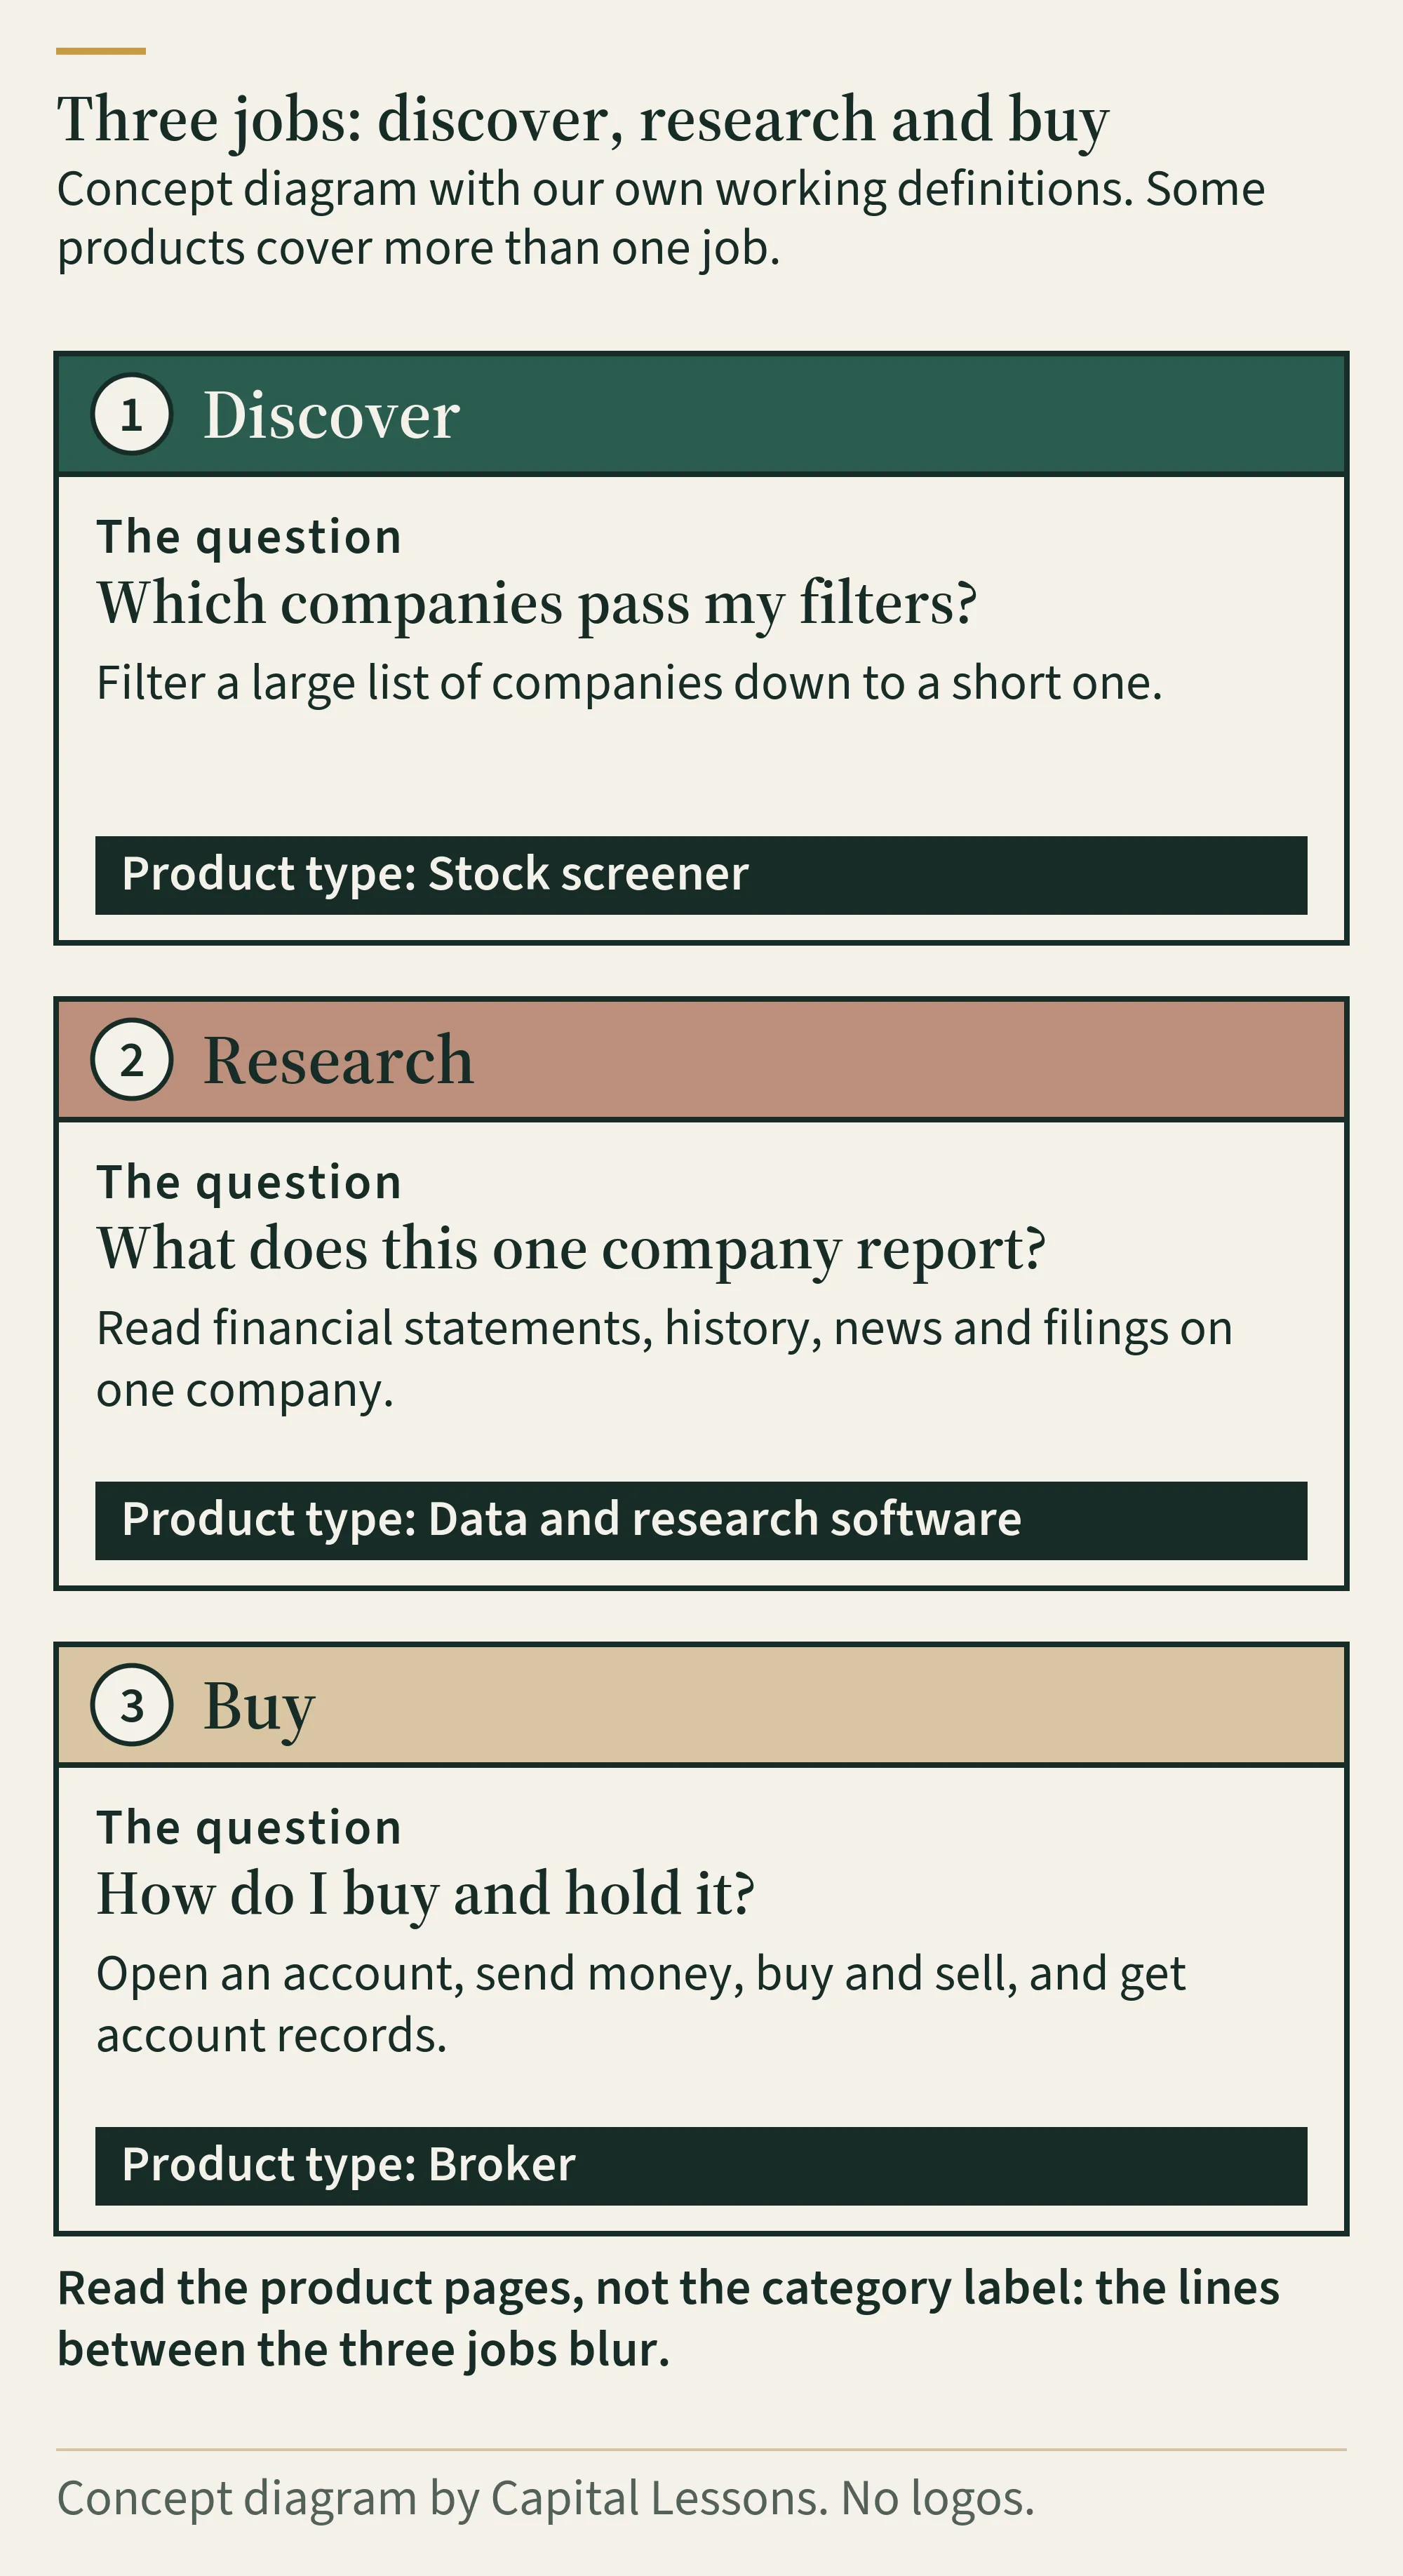
- Discover. Filter a large list of companies down to a short one. That is a stock screener.
- Research. Read financial statements, history, news and filings on one company. That is data and research software.
- Buy. Open an account, send money, place orders and get account records. That is a broker.
Some products cover more than one job. Schwab’s global investing page, for example, lists an international stock screener and research from Schwab and third parties. So read the product pages, whatever the category label says. These three jobs are our own working definitions.
Match the need to the job
| What you need | Function to look for | What to check |
|---|---|---|
| Study a company you already know | Financial statements and history in one place | How many years the free plan shows, and whether you can export |
| Find companies among many options | A screener | Which filters the free plan has, which markets it covers, how many screens you can save |
| Buy shares | A broker | Whether it opens accounts where you live, the full fee page, which markets you can trade |
| Send orders from charts you already use | A charting tool linked to a compatible broker | Whether your broker is on the tool’s list. The account and execution stay with the broker |
Start with what you already have. If you have a broker account, or plan to open one, check its screener and research pages before you pay for anything else. Add a separate tool when you hit a limit you can name, such as too few years of statements, a market the screener doesn’t cover, or no export. A free plan is the cheapest way to find out.
How we compared them
We compared what the providers publish on their own pages, read on November 4, 2026. This isn’t a full test of using each product. We also checked the Finviz screener help and the free Stock Analysis screener page for the filters they list. The list is a sample and doesn’t rank anything. Prices change, so check the page before you decide.
Screeners and research tools
- Finviz. A screener and charting site for US markets only. It covers NASDAQ, NYSE and AMEX and says it has no plans to add others for now. The Elite free trial needs a credit card and renews as a paid plan unless you cancel.
- Stock Analysis. Financial statements and a screener for global stocks and funds. Pro limits you to 1 download a day, 100 stocks per watchlist and 100 active alerts. Unlimited removes those limits and is listed at $16.58 per month billed annually.
- TradingView. Charts, a screener and market data. It connects compatible brokers, Interactive Brokers for example, and says it “doesn’t process your trades and acts as an interface only.” The account and execution stay with your broker. TradingView isn’t a broker. Real-time data costs extra: most stock exchanges charge for it and the paid plans don’t cover those fees. By default its US stock data comes from Cboe, and direct NASDAQ or NYSE data is added separately. Its plan table lists screeners across 150+ exchanges from 50+ countries and 500+ fundamental and technical fields.
- Koyfin. A research and portfolio tool. The free plan lists 2 watchlists, 2 screens and two years of financials.
- Yahoo Finance. Free to use, with paid plans for portfolio tools, research and no ads. It accepts US bank-issued debit and credit cards from Visa, Mastercard, American Express or Discover, so check first if yours is issued outside the US.
What the plans cost
| Product | Free plan | Paid entry plan | Monthly price | Billed annually, as published | Main reason to upgrade |
|---|---|---|---|---|---|
| Finviz | Yes | Elite | $39.50 | $299.50 per year (listed as $24.96 per month) | Real-time quotes (free registered: delayed 1 minute), 8 years of statements (free registered: 3), unlimited presets (free registered: 50), alerts, export |
| Stock Analysis | Yes | Pro | $9.99 | $79 per year (about $6.58 per month) | Longer financial history, data exports, saved screeners and no ads. |
| TradingView | Yes (Basic) | Essential | $14.95 | $12.95/month with annual billing. Displayed pricing and taxes may vary by location. | More charts, indicators and alerts. |
| Koyfin | Yes | Plus | Check the page | $39 per month with the annual plan selected. Koyfin says annual saves up to 30% | Stock and ETF screener, unlimited watchlists and screens, 10 years of financials |
| Yahoo Finance | Yes | Bronze | $9.95 | $95.40 per year (listed as $7.95 per month) | Portfolio tools and no ads. Gold lists smart screeners and about 40 years of statements |
How to read it:
- Billing. “Billed annually” means you pay for a year at once. Finviz, Stock Analysis and Yahoo publish a yearly amount. Koyfin and TradingView show a monthly price for the annual plan. Annual billing is cheaper than paying month by month.
- Promo or regular. TradingView’s $12.95 is a “special price”, the monthly price on an annual plan. Its regular monthly price is $14.95. Yahoo says yearly billing is 20% off. The other pages don’t mark their prices as promotions.
- Currency and taxes. Finviz states USD and the others show a dollar sign. Displayed pricing and taxes may vary by location. Check the checkout page for the amount you will be charged.
- Higher plans. Each provider has them. They matter only when the entry plan hits a limit you can name.
Brokers: where you buy
Check this first: where you can open an account.
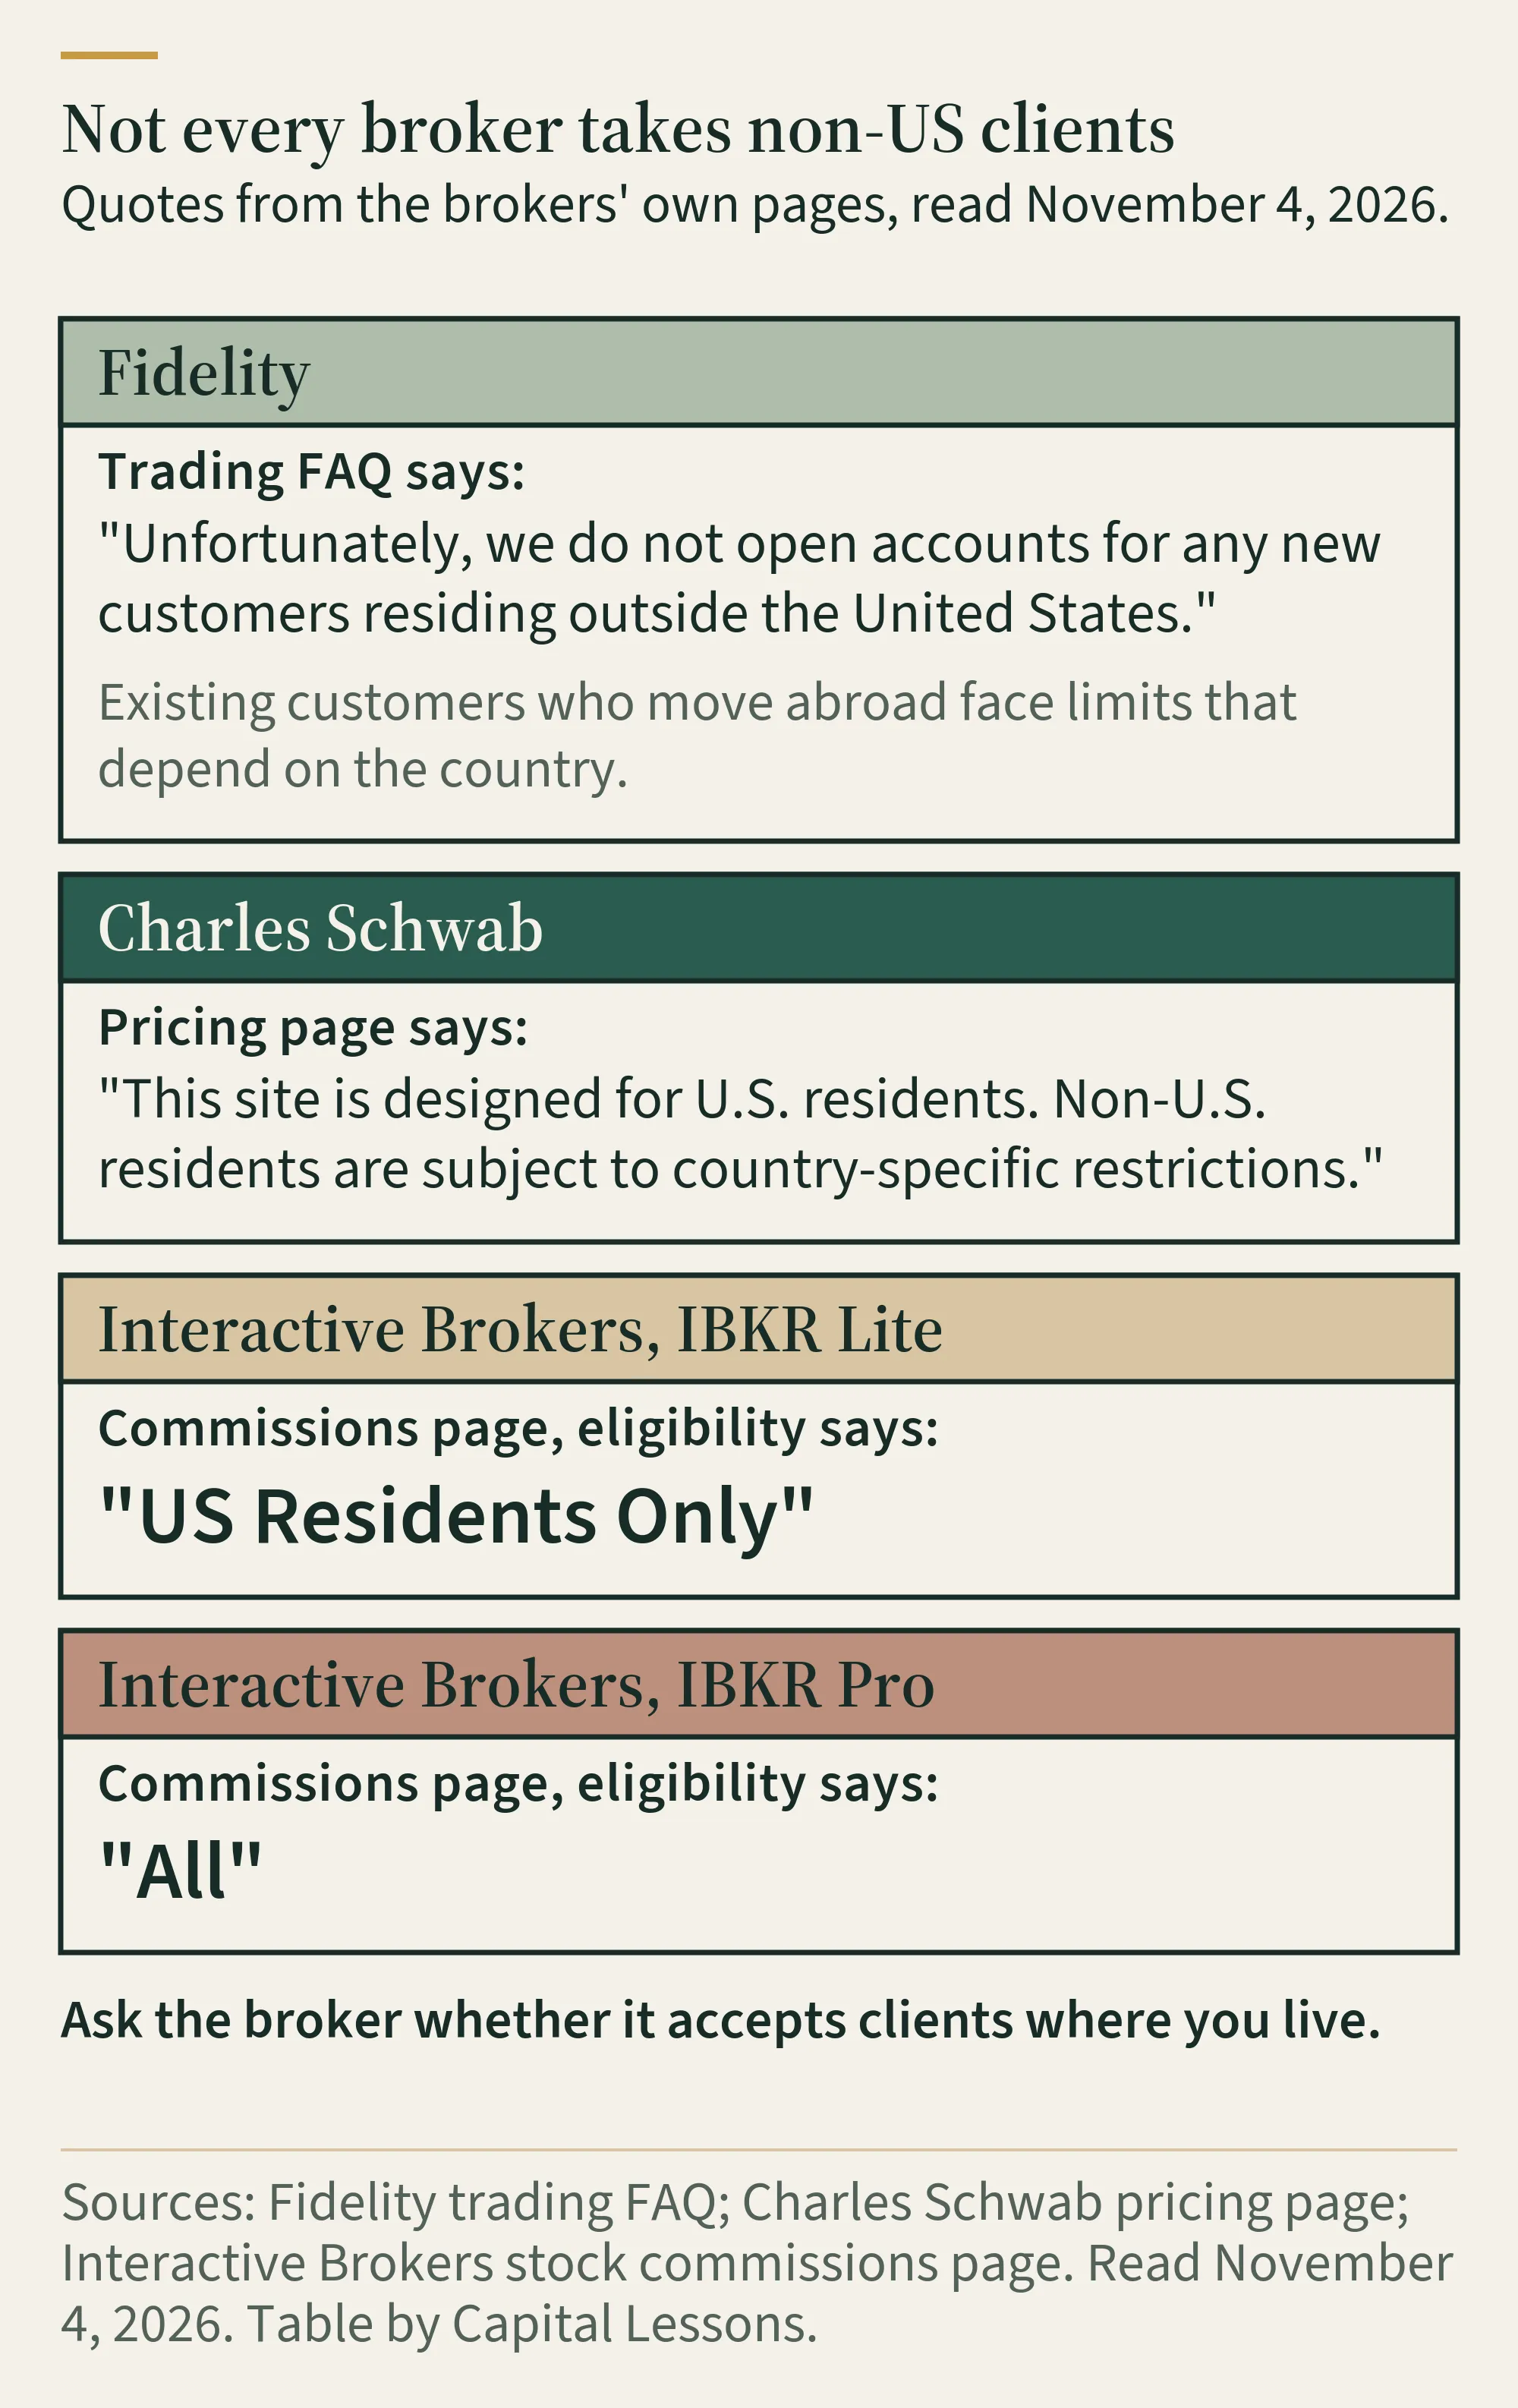
- Fidelity: its FAQ says “Unfortunately, we do not open accounts for any new customers residing outside the United States.” Existing customers who move abroad face limits that depend on the country. In some countries they can only sell their holdings and withdraw the money, with no deposits or new purchases. In most others the limits are lighter, and margin lending or options trading may not be permitted. Customers residing outside the US can’t buy mutual fund shares. They can keep the ones they hold, other than certain holdings in previously discretionary managed accounts.
- Charles Schwab: the pricing page says “This site is designed for U.S. residents. Non-U.S. residents are subject to country-specific restrictions.”
- Interactive Brokers: IBKR Lite eligibility is “US Residents Only”. IBKR Pro is “All”. Ask Interactive Brokers whether you can open an account in your country.
If you live outside the US, check each broker’s rules before you plan around it.
| Broker | Listed as $0 | What it doesn’t cover |
|---|---|---|
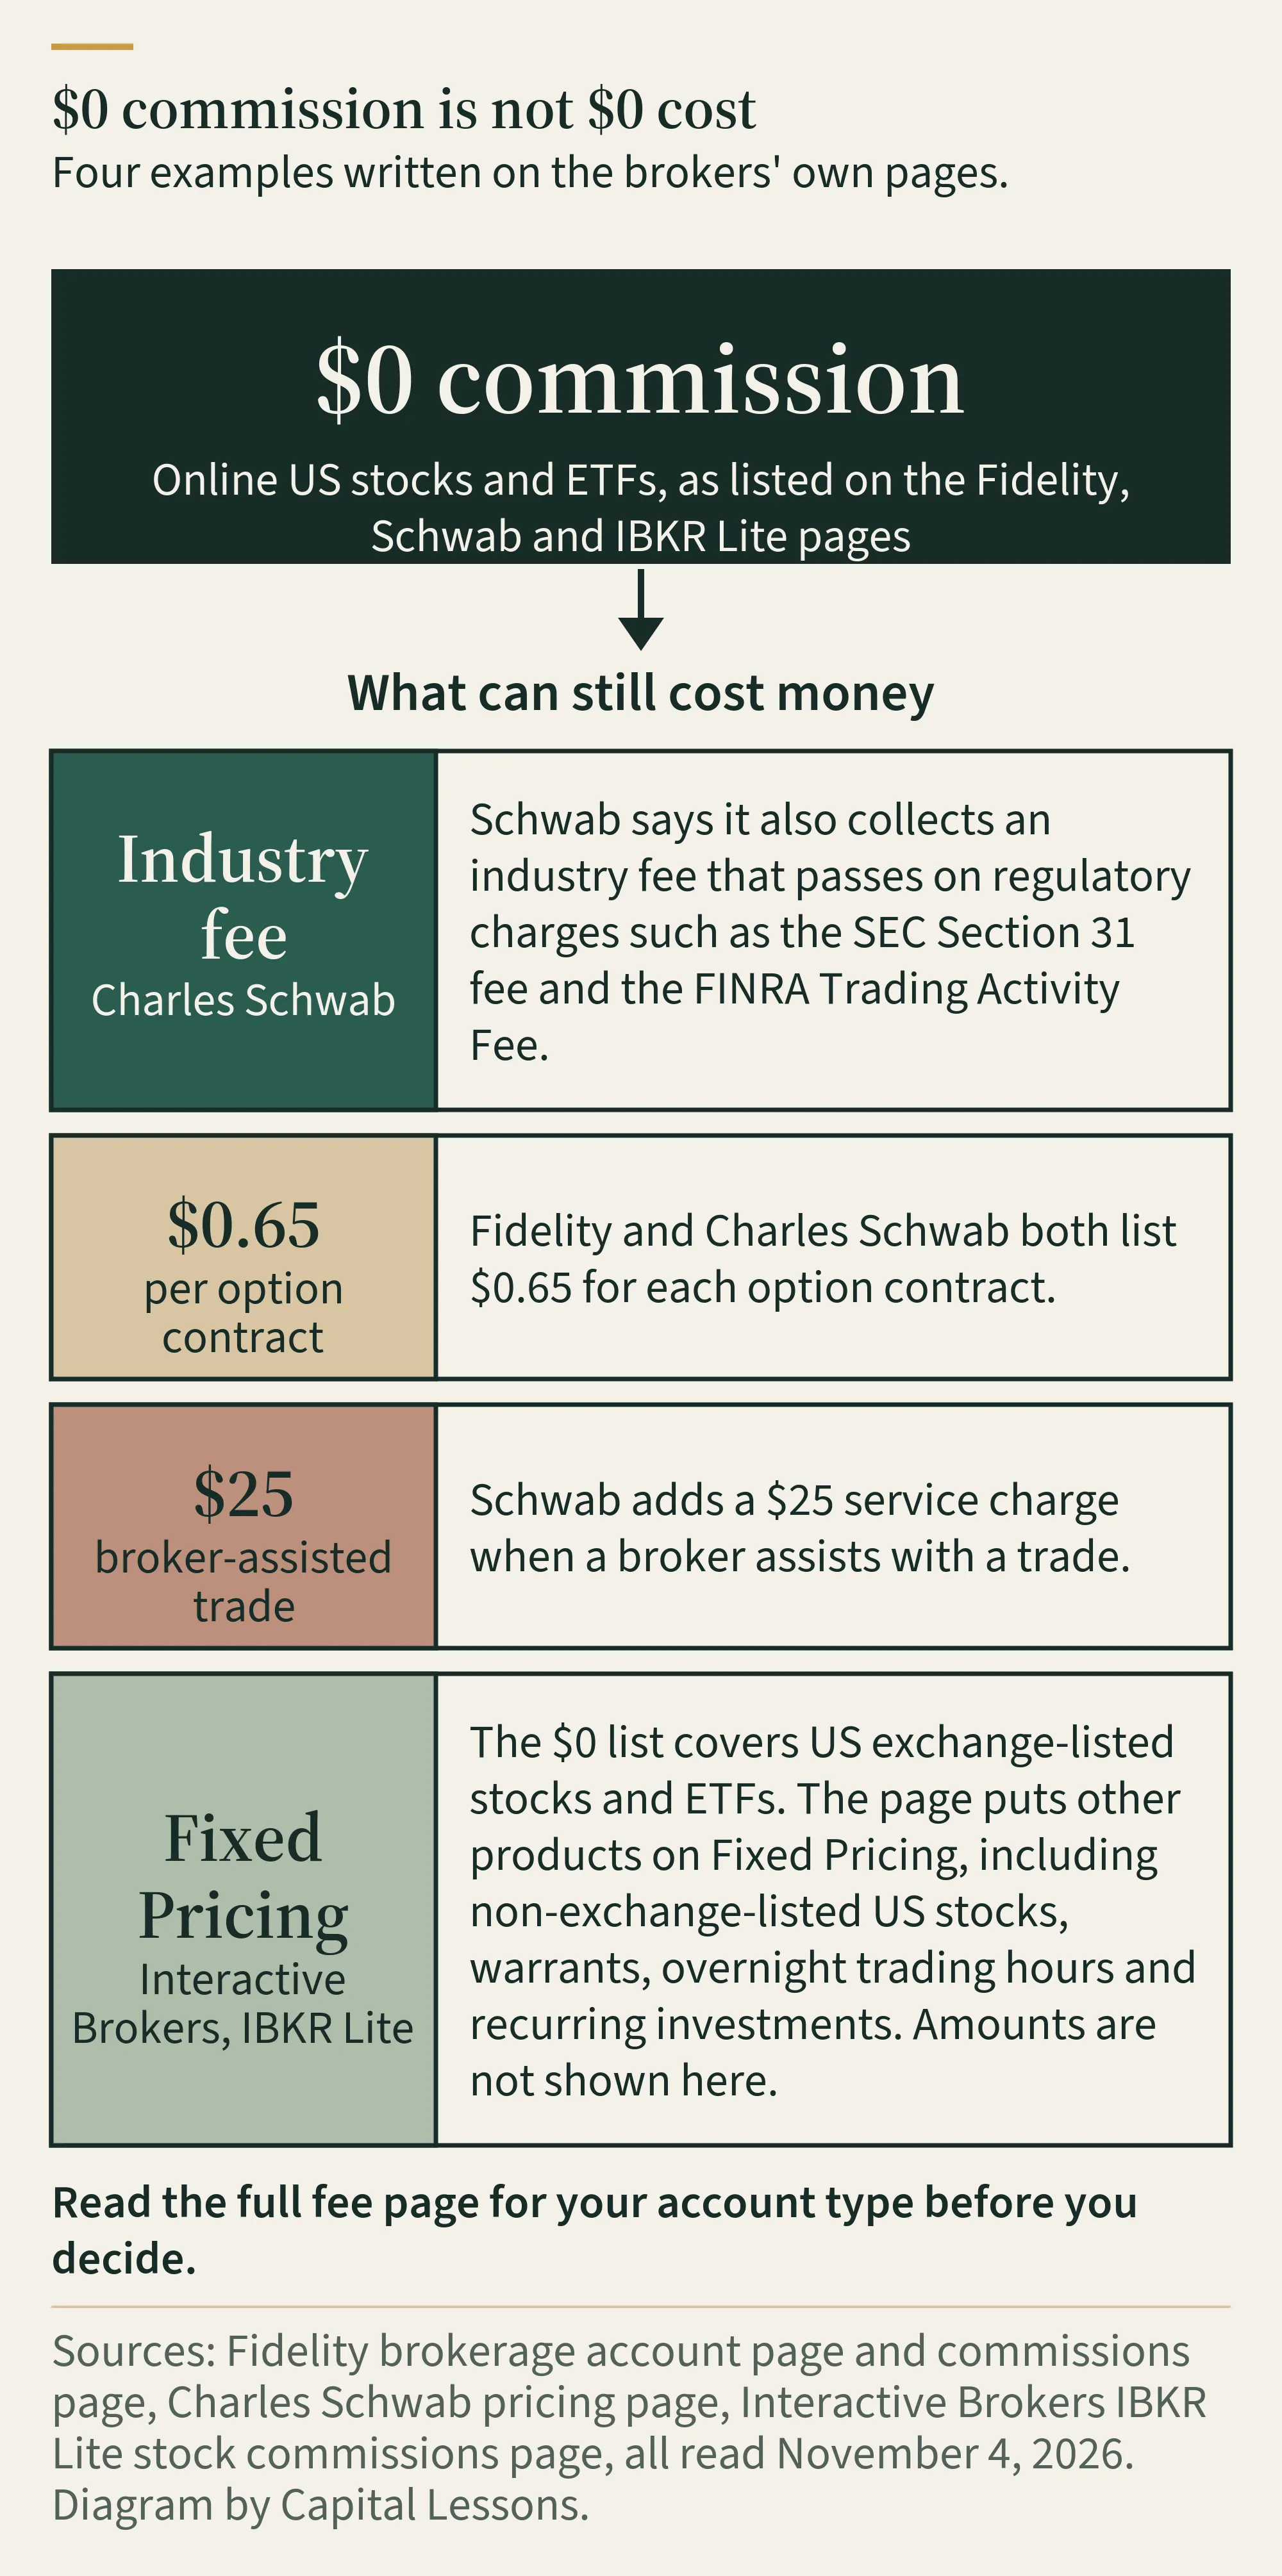
| Fidelity | Online US stock and ETF trades | Options are $0.65 per contract. Accounts Fidelity designates as Professional Equity Traders pay $0.001 per share, rounded up to the nearest $0.01 per order |
| Charles Schwab | Online listed stocks and ETFs | Broker-assisted trades add $25. US over-the-counter stocks online are $6.95. Options are $0.65 per contract. Foreign exchanges depend on the account: the standard pricing page lists them as not available online, and the Schwab Global Account lists online trading in 12 foreign markets in local currencies |
| Interactive Brokers, IBKR Lite | US exchange-listed stocks and ETFs | Other products are on Fixed Pricing: non-exchange-listed US stocks, delisted ETPs, warrants, overnight trading hours and recurring investments |
“$0 commission” doesn’t mean “$0 cost.” Schwab says it also collects an industry fee that passes on regulatory charges such as the SEC Section 31 fee and the FINRA Trading Activity Fee. Foreign-market trades have their own commissions. Read the full fee page for your account type.
For US brokers, FINRA’s BrokerCheck shows whether a firm is registered and what disclosures it has. A registration isn’t a quality score.
What a screener can and can’t tell you
A screener shows which companies pass your filters. It doesn’t say why. Finviz’s screener help defines P/S and Net Profit Margin, and Stock Analysis’s free screener lists PS Ratio and Profit Margin. Either is a fair place to try them.
Price-to-sales is the stock’s price divided by sales per share, which Finviz describes as the value the market places on sales. A low ratio can sit next to a business whose sales are shrinking. A high ratio means investors are paying a lot today for each dollar of sales, and that price may already carry expectations that never happen.
Net profit margin shows how much of every dollar of sales a company keeps in earnings, in Finviz’s words. It helps you skip companies that lose money. It doesn’t say where the profit comes from.
Which one to try next
There’s no winner here. The right next step depends on the job in front of you.
- You know the company. Start with its filings on EDGAR. Add a data tool when you want years of statements in one place.
- You want to find companies. Try the free plan of a screener. Finviz works if US markets are enough. Stock Analysis covers a wider list of global stocks. Consider a paid plan when you hit a limit you can name, such as delayed quotes, a missing filter or no export.
- You want to buy shares. You need a broker. Check eligibility for your country, then read the full fee page past the $0 line. If your broker has a screener, try that before you pay for another tool.
- You want to send orders from charts. TradingView connects to compatible brokers. Check that yours is on its list.
Keep reading
- Good Company vs Good Investment: Why the Price You Pay Matters. Once a screener gives you a price-to-sales number, this guide shows why the price carries expectations and what to ask before you buy.
- The Dot-Com Bubble Explained: How Money, IPOs and Incentives Fed the Boom. It shows median price-to-sales ratios and how few technology IPOs were profitable, which helps when a screener shows a high multiple.
Notes on the numbers
Prices, plans and fee schedules come from the official pages listed in the sources. They are the providers’ figures and change without notice. This article is educational. We can say which kind of tool fits which need, and the criteria above show how. We don’t know your finances or goals, so this isn’t personal financial advice. See our Terms and Editorial Policy.
Links to Finviz, Stock Analysis and TradingView in this article are affiliate links. We may earn a commission if you purchase a paid subscription through them. See our Affiliate Disclosure.
Sources
- Finviz Elite: Pricing and FAQ · Finviz
- Finviz Screener Help · Finviz
- Stock Analysis Pro · Stock Analysis
- Stock Screener · Stock Analysis
- TradingView Subscriptions: Pricing and Features · TradingView
- How to trade on TradingView · TradingView
- Finding your perfect broker on TradingView · TradingView
- What should I do to be able to trade through Interactive Brokers on TradingView? · TradingView
- How to purchase additional market data · TradingView
- Koyfin pricing plans and subscription FAQ · Koyfin
- Choose your plan · Yahoo Finance
- Trading FAQs: About Your Account (customers residing outside of the United States) · Fidelity Investments
- Commissions, Margin Rates, and Fees · Fidelity Investments
- Open a Brokerage Account (commission footnotes) · Fidelity Investments
- Pricing · Charles Schwab
- Schwab Global Account · Charles Schwab
- Global Investing · Charles Schwab
- Commissions Stocks · Interactive Brokers
- BrokerCheck · FINRA
- EDGAR full text search · U.S. Securities and Exchange Commission